Meta RNAseq analysis in S. mansoni
The following results were obtained from:
Lu Z, Berriman M (2018) Meta-analysis of RNA-seq studies reveals genes responsible for life stage-dominant functions in Schistosoma mansoni. bioRxiv 308189; doi: https://doi.org/10.1101/308189
Sample information
| Type | Label | Sequence Source | Sample Accession | Biological Replicates | Reference |
|---|---|---|---|---|---|
| Gonad (testis) | bTe | PRJEB14695 | ERS420096, ERS420097, ERS420098 | 3 | Lu et al. (2016) |
| Gonad (ovary) | bOv | PRJEB14695 | ERS420090, ERS420091, ERS420092 | 3 | Lu et al. (2016) |
| Egg | Egg | PRJNA294789 | SRR2245469 | 1 | Anderson et al. (2015) |
| Miracidium | Mir | PRJNA209511 | SRR922067 | 1 | Wang et al. (2013) |
| Sporocyst (48h) | Spo | PRJNA209511 | SRR922068 | 1 | Wang et al. (2013) |
| Cercaria | Cer | PRJEB2350 | ERR022872, ERR022877, ERR022878 | 3 | Protasio et al. (2012) |
| Schistosomulum (3h) | Som | PRJEB2350 | ERR022874, ERR022876 | 2 | Protasio et al. (2012) |
| Adult male before pairing | sMa | PRJEB14695 | ERS420103, ERS420104, ERS420105 | 3 | Lu et al. (2016) |
| Adult female before pairing | sFe | PRJEB14695 | ERS420108, ERS420109, ERS420110 | 3 | Lu et al. (2016) |
| Adult male after pairing | bMa | PRJEB14695 | ERS420093, ERS420106, ERS420107 | 3 | Lu et al. (2016) |
| Adult female after pairing | bFe | PRJEB14695 | ERS420099, ERS420100, ERS420101 | 3 | Lu et al. (2016) |
Note that there are variations in S. mansoni strain and definitive host in these studies.
Analysis pipeline
Reads were mapped to S. mansoni genome annotation V5.2 using HISAT2 (v2.1.0) for egg and STAR (v2.4.2a) for the rest samples. Counts per gene were summarised with featureCounts (v1.4.5-p1) on the latest annotation (GeneDB data on 10/07/2017). Read counts were normalised in edgeR (v3.16.5) using the TMM method1 and differential expression was analysed using the GLM approach (glmFit() and glmLRT())2. RPKM values were calculated based on normalised library sizes3 and mean values were used for biological replicates (indicated as “Normalised expression” in the charts).
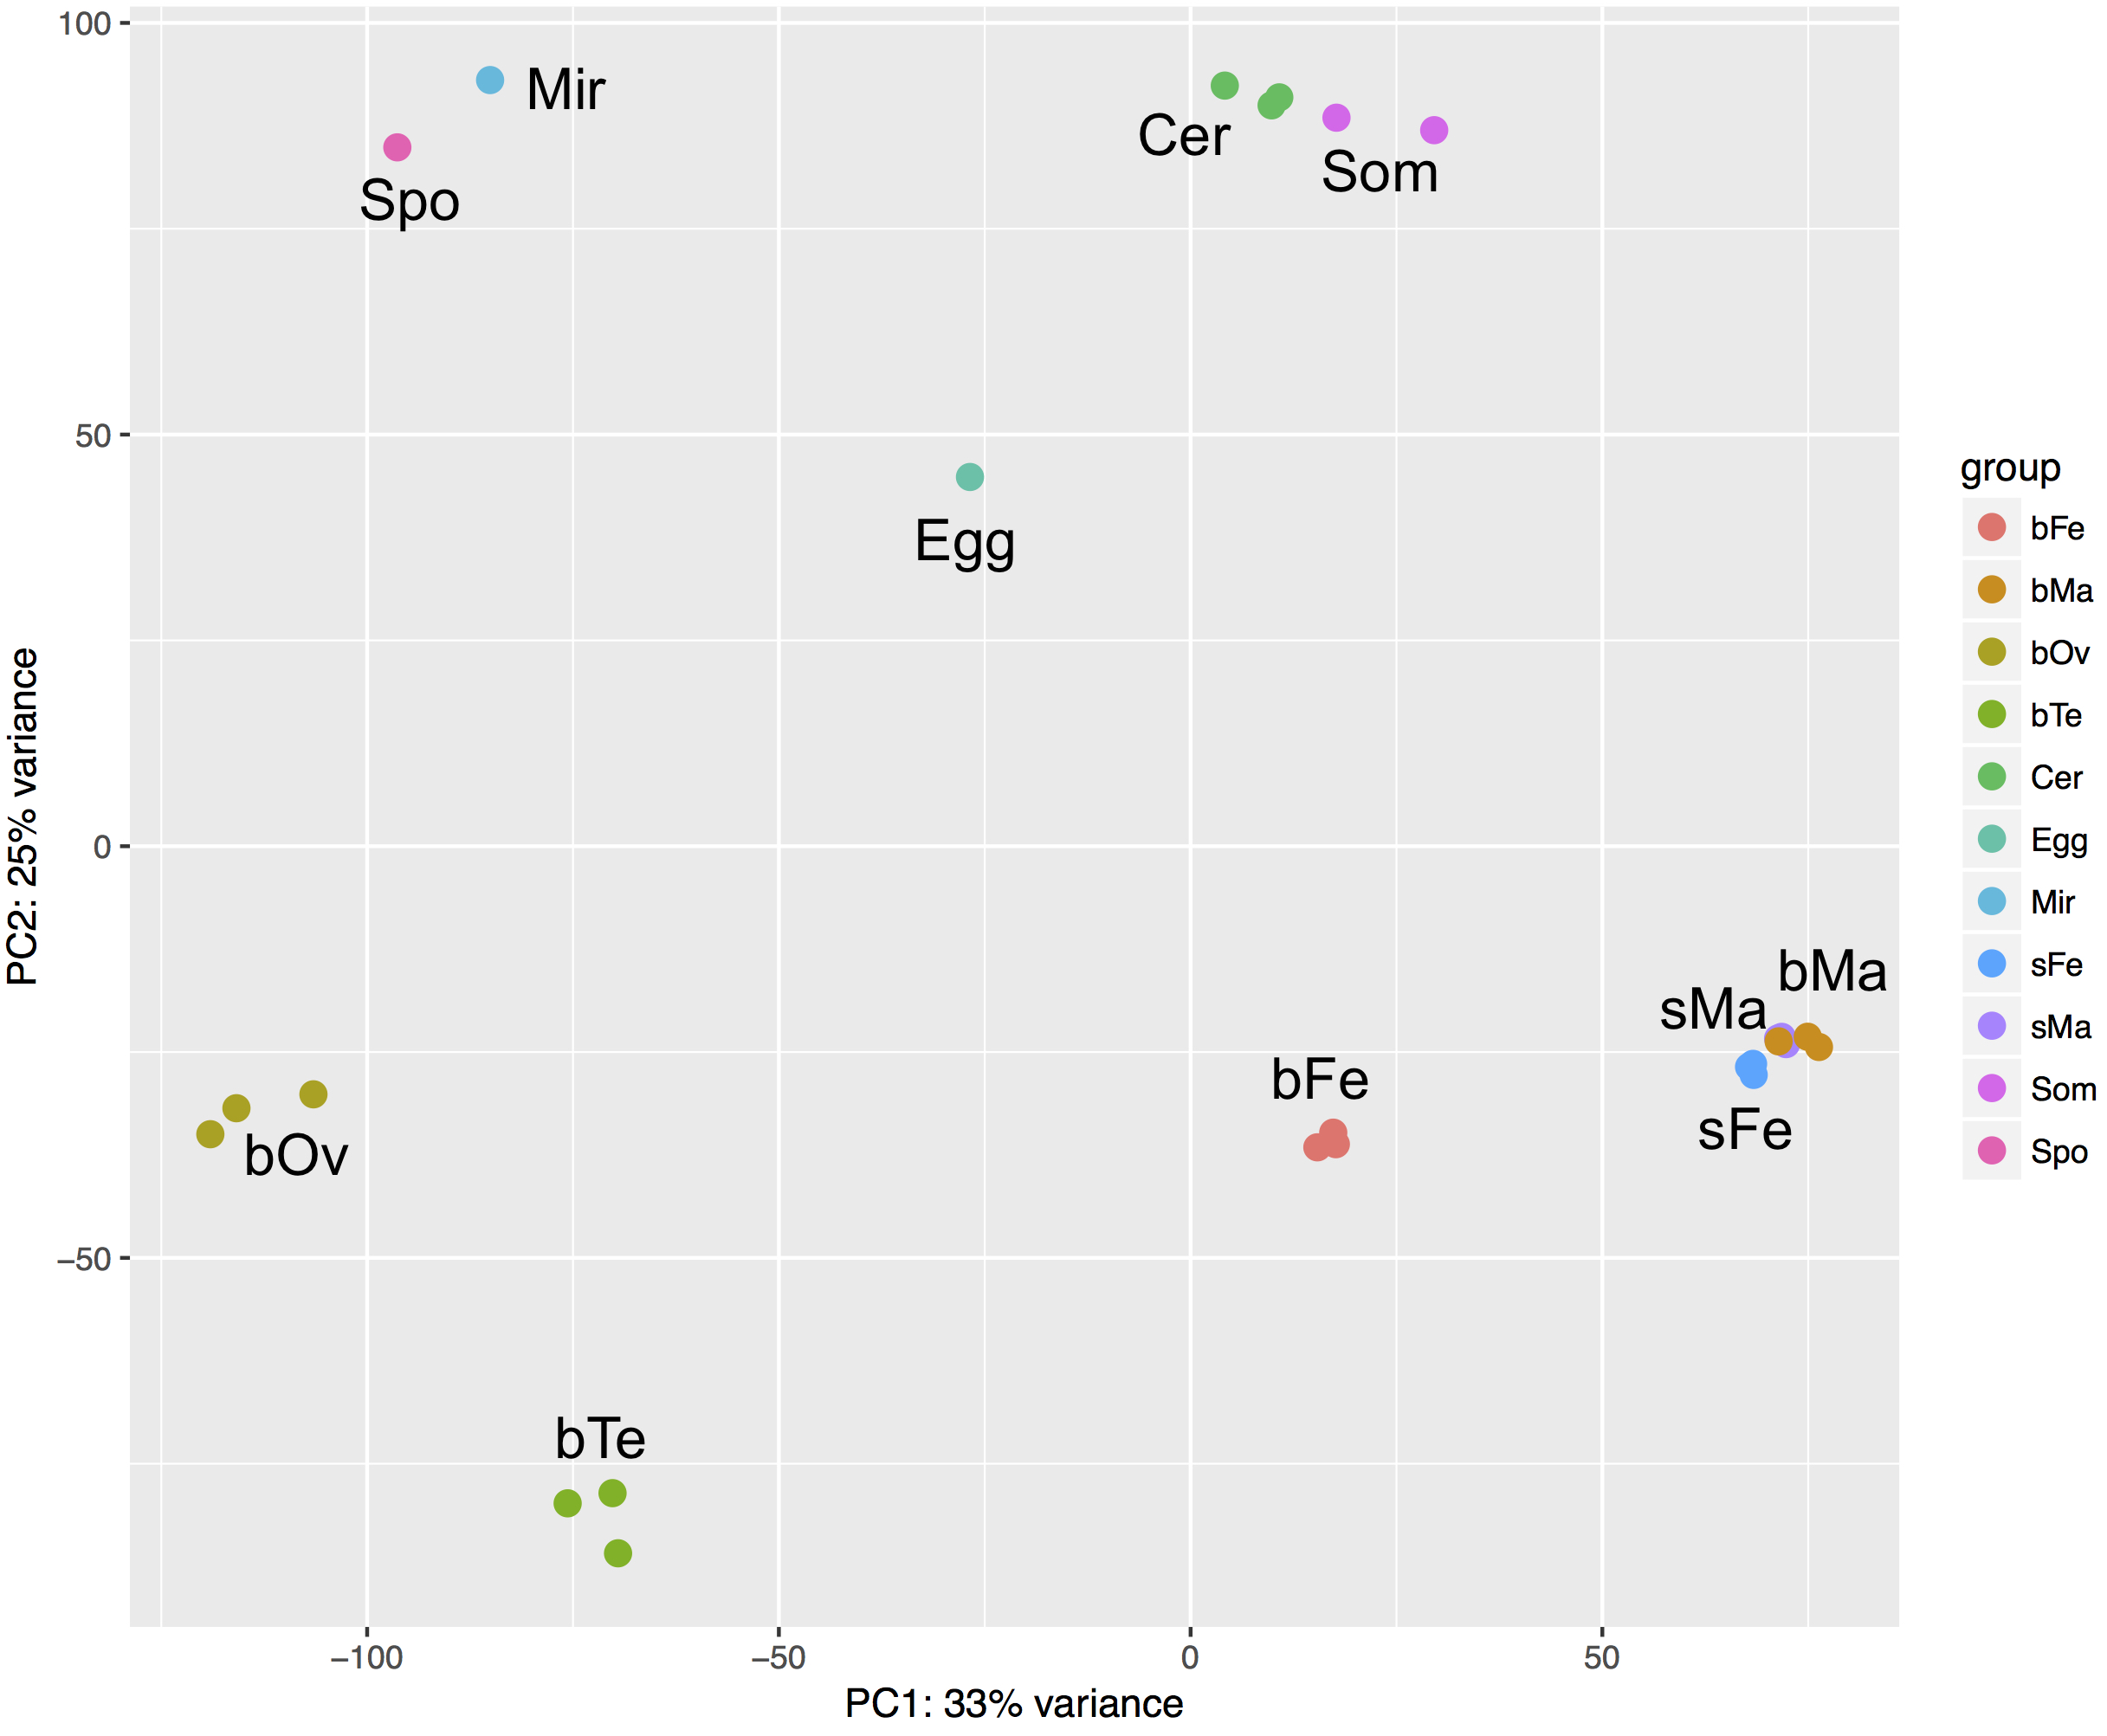
Data Exploration
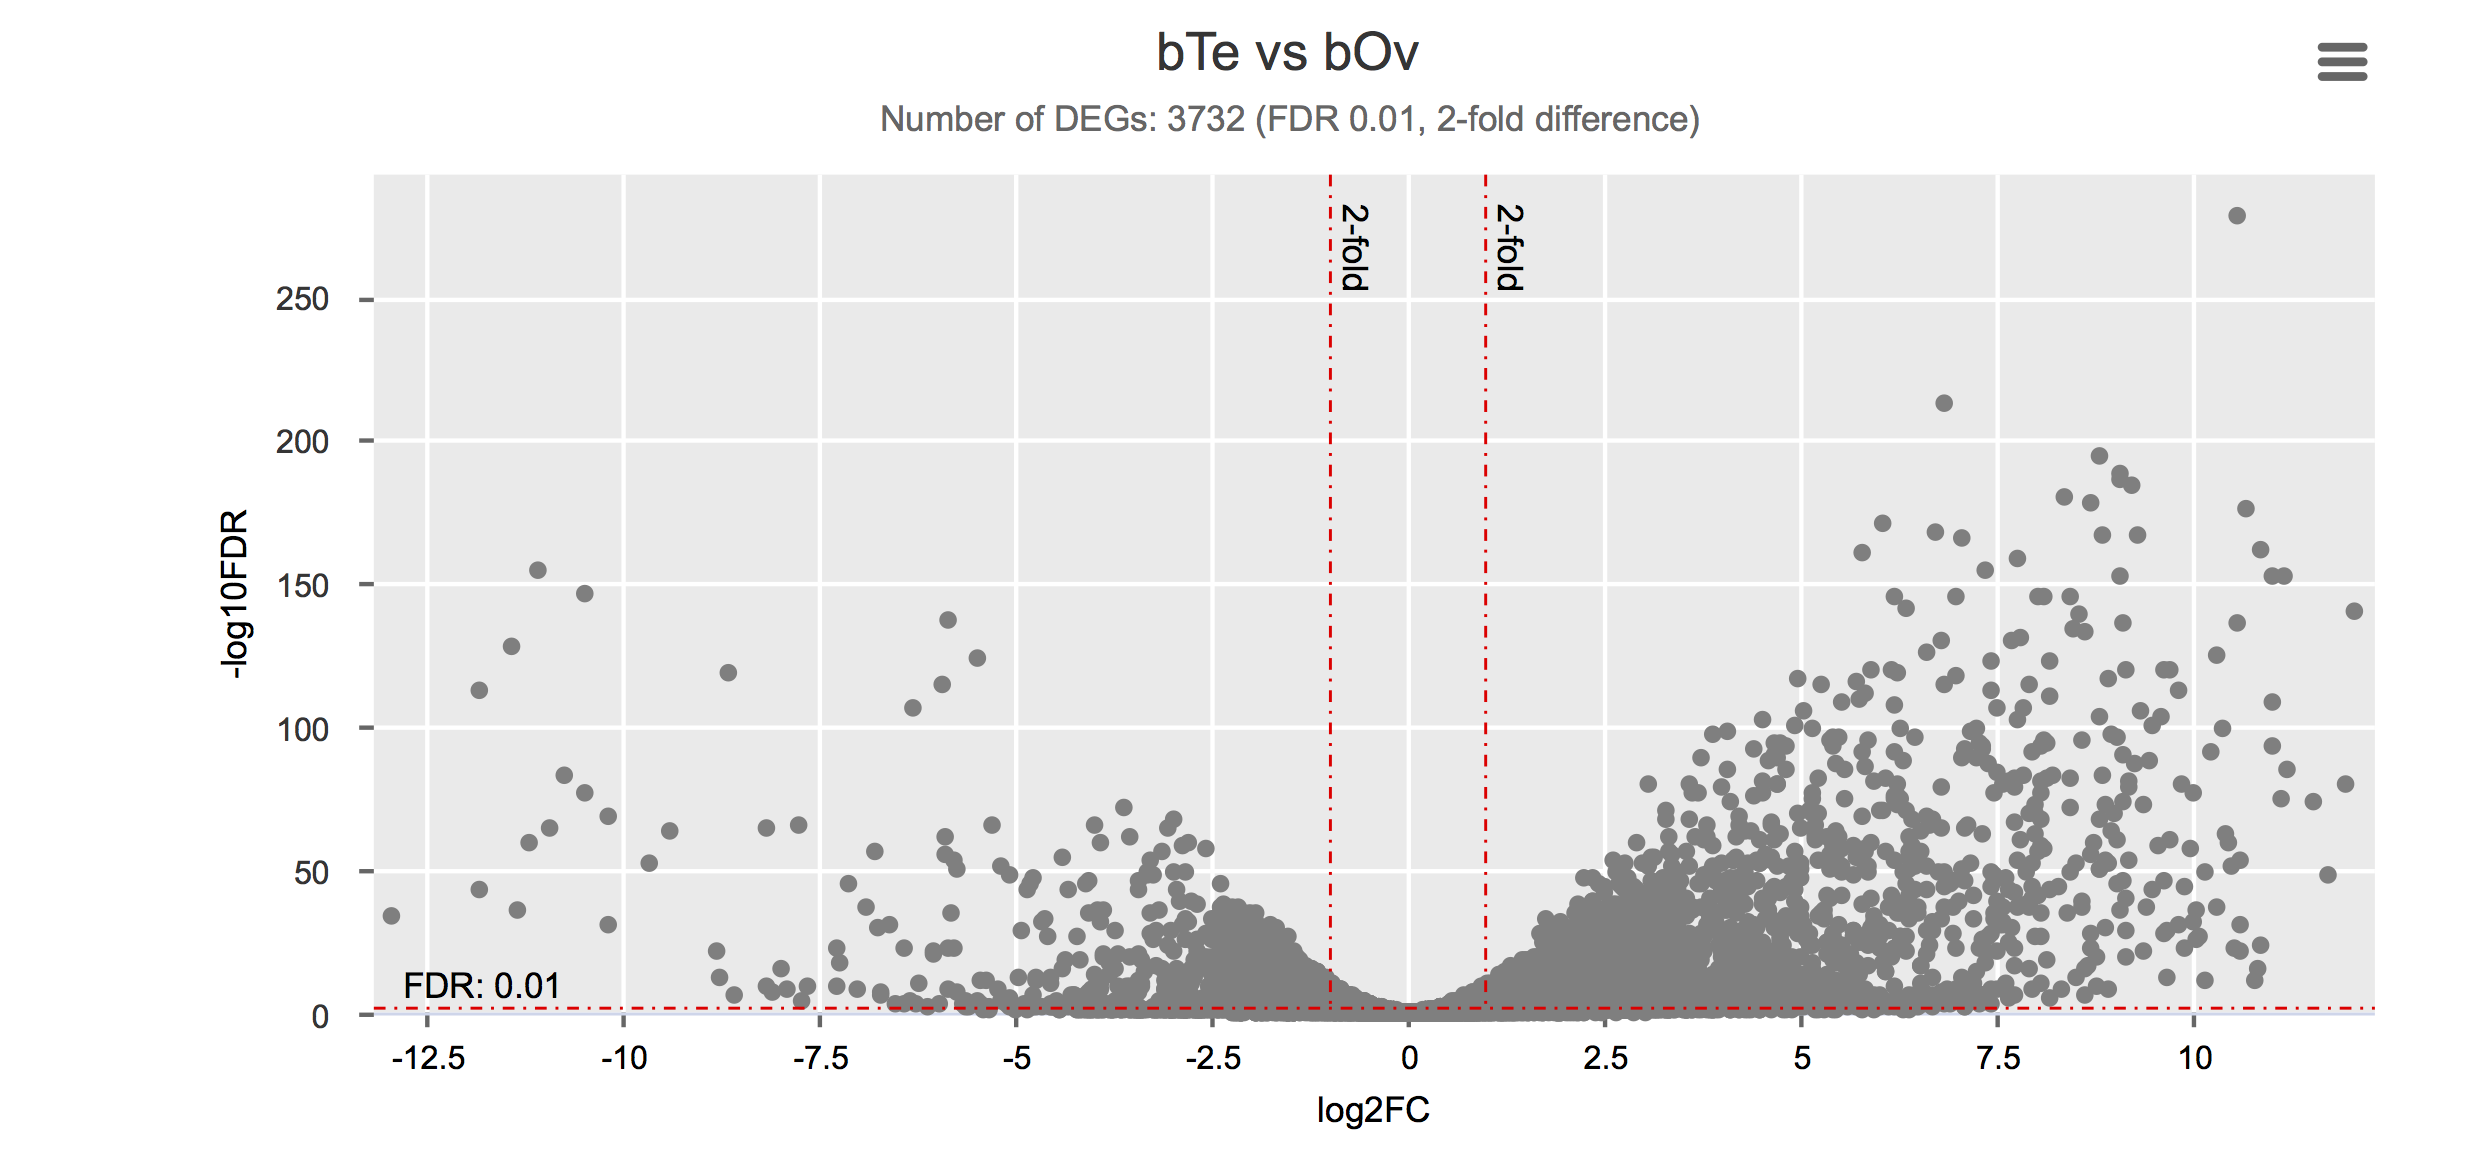
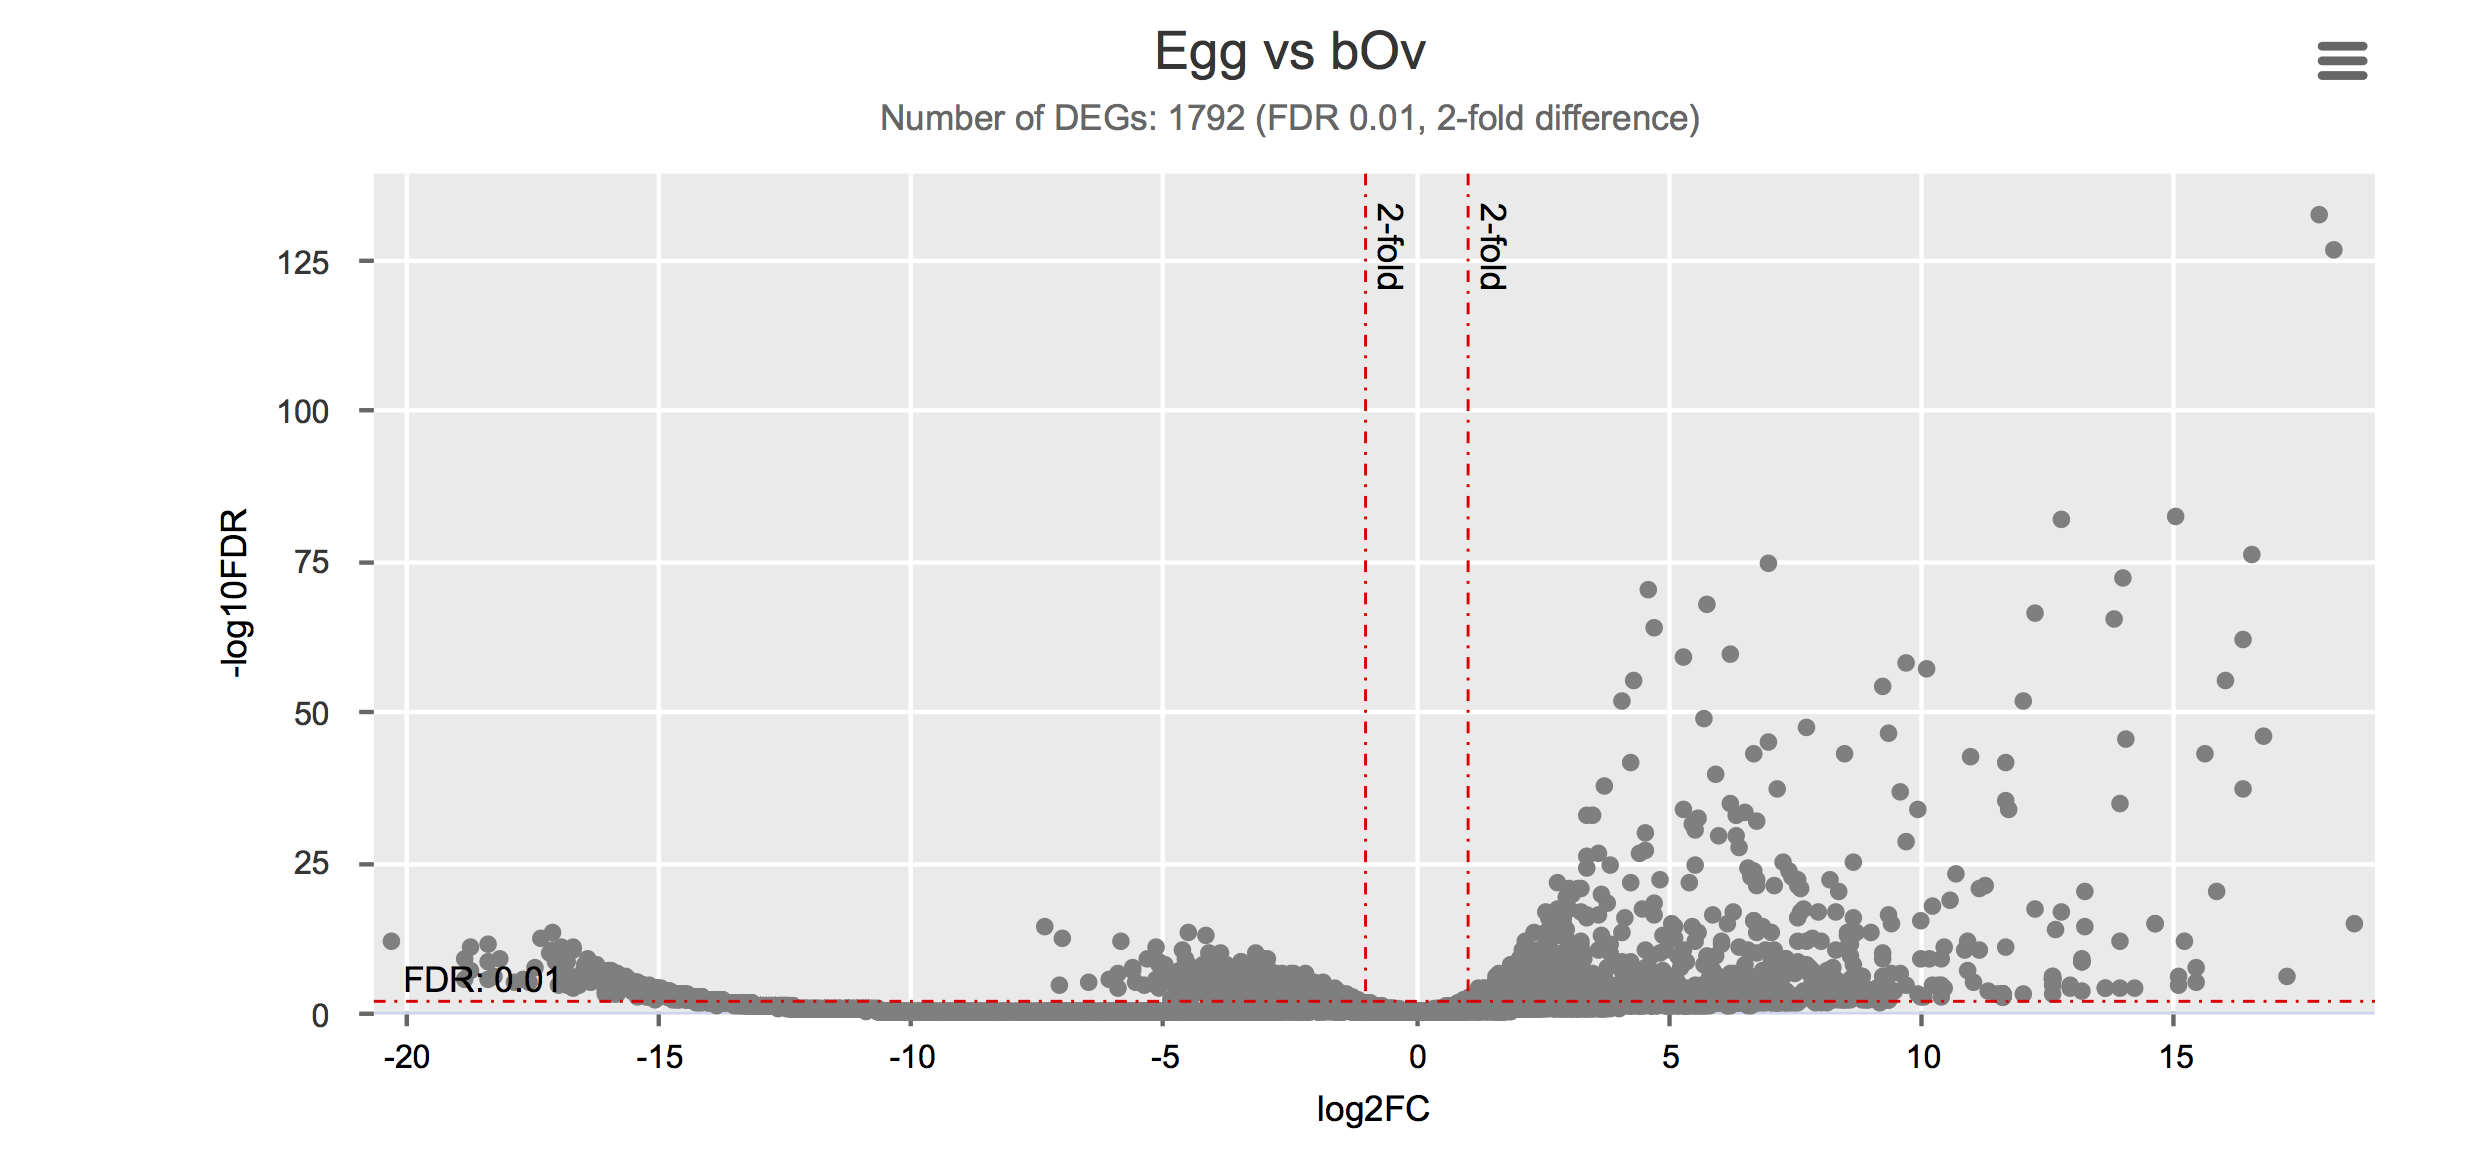
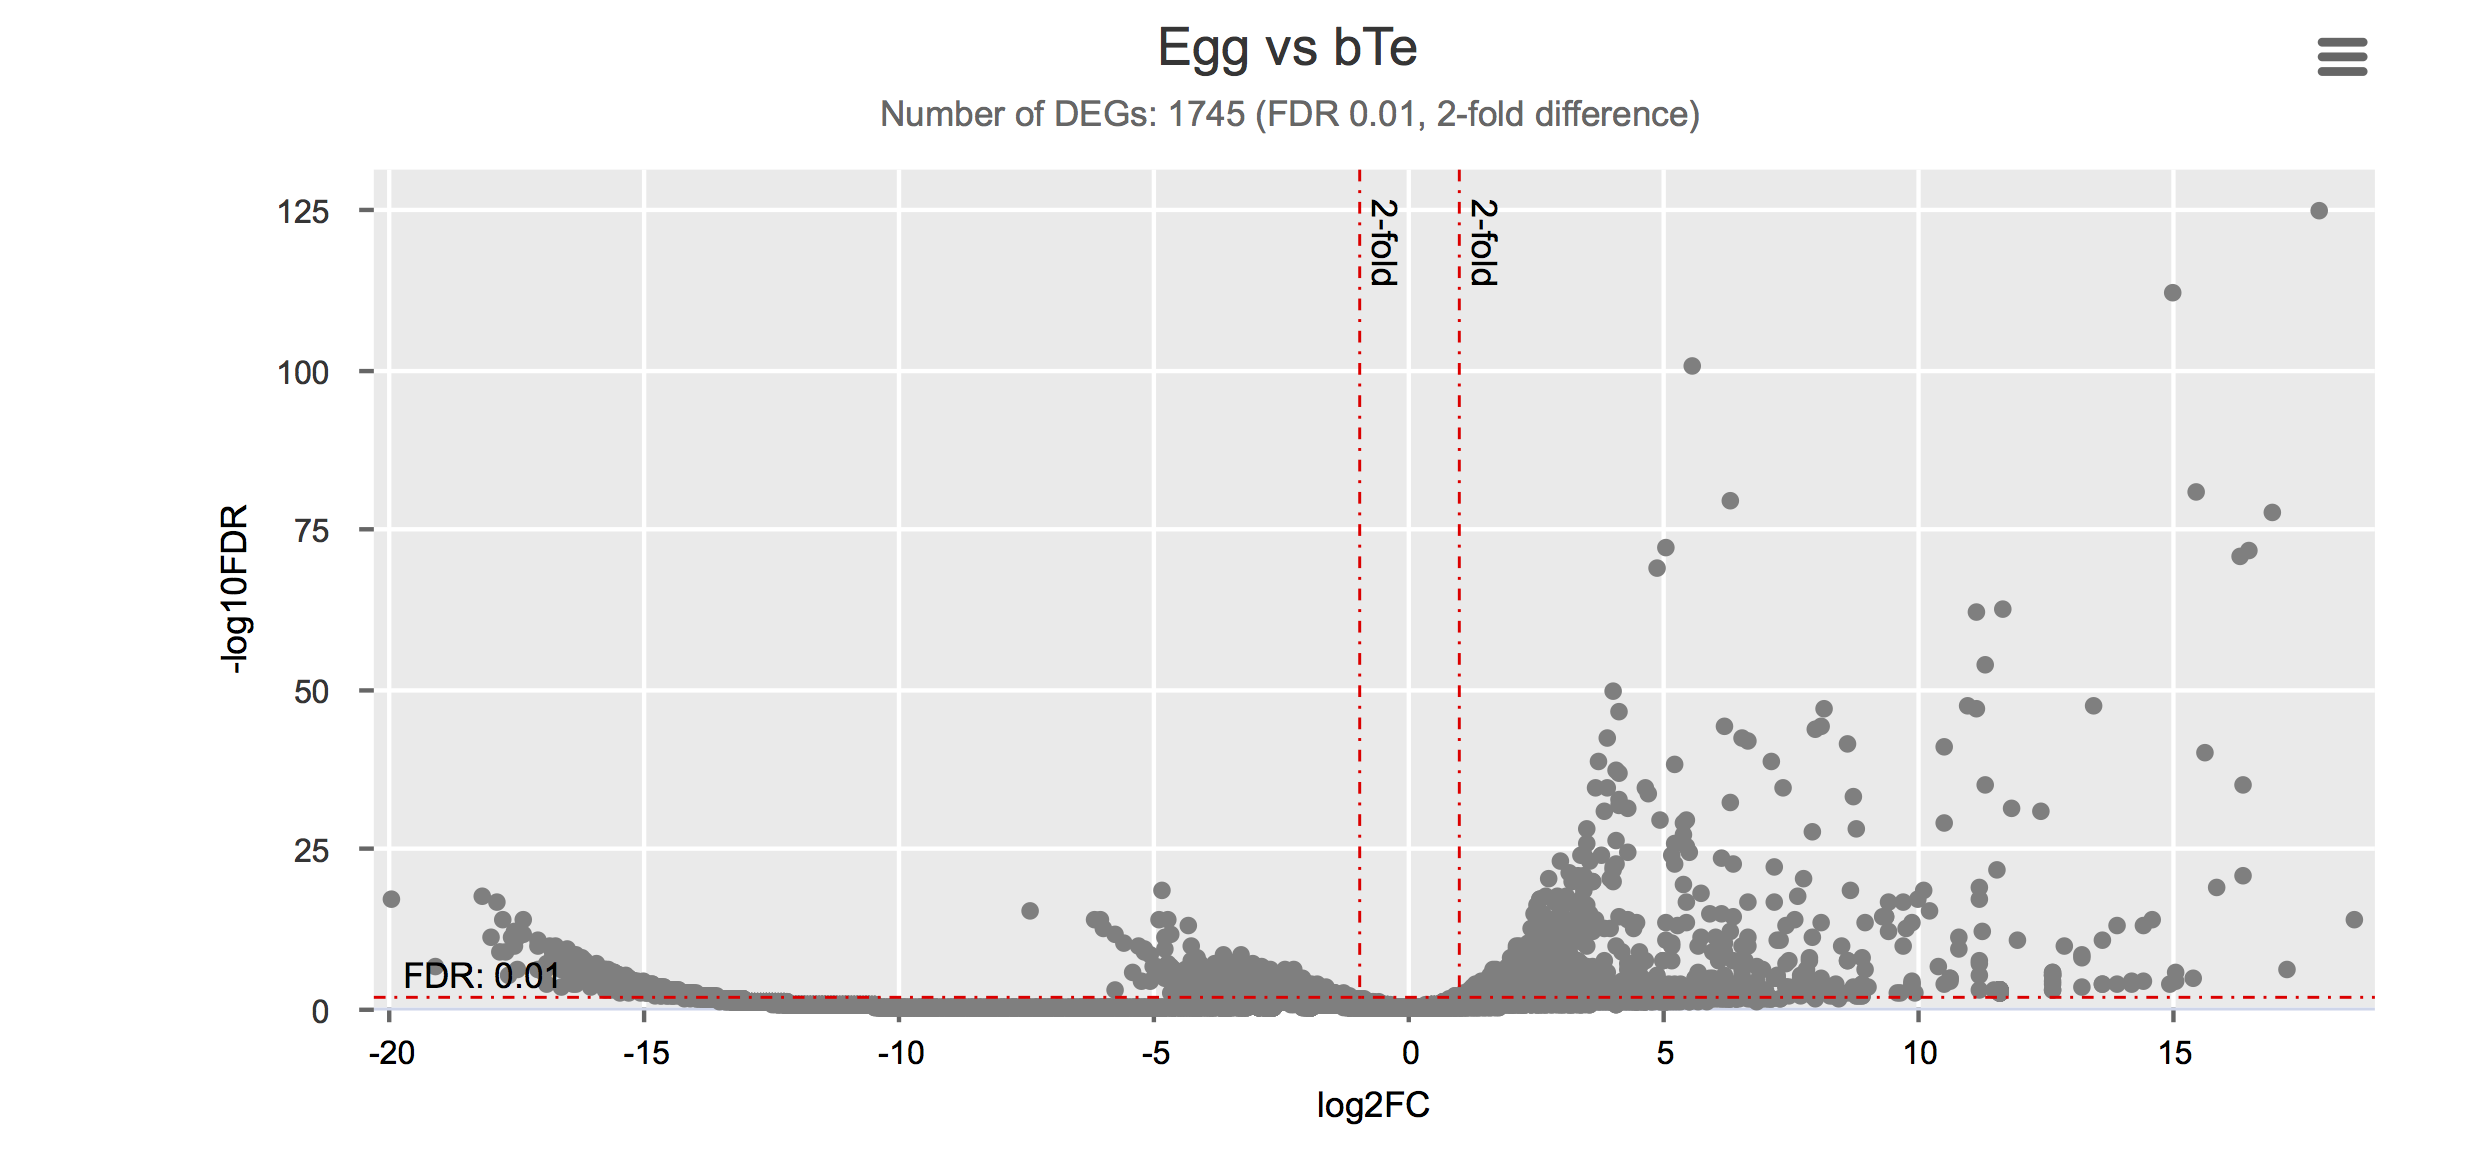
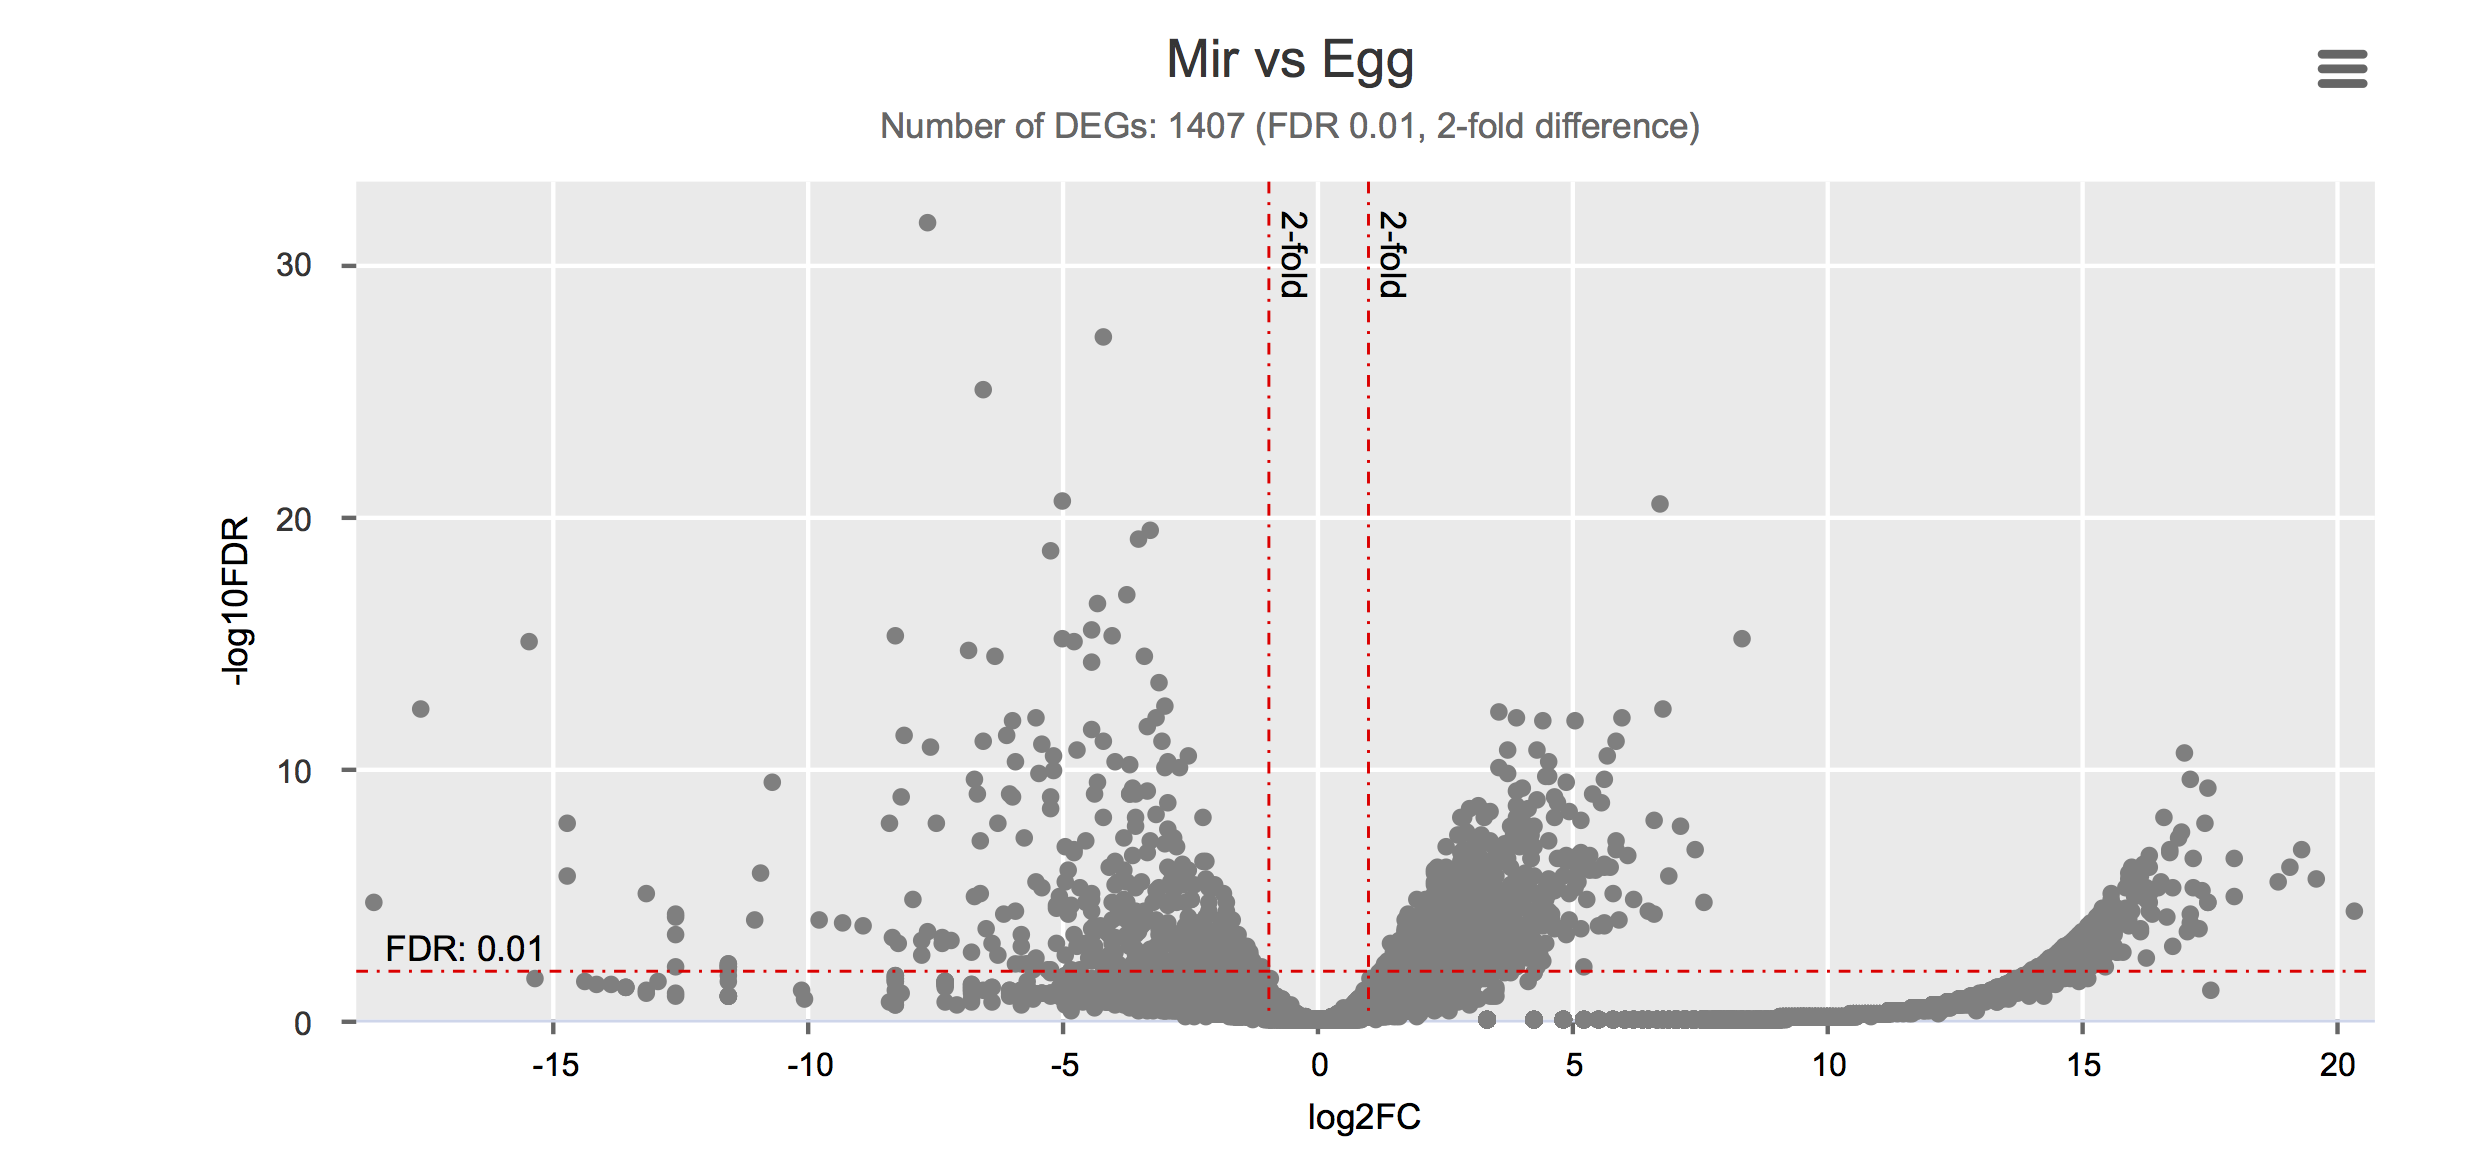
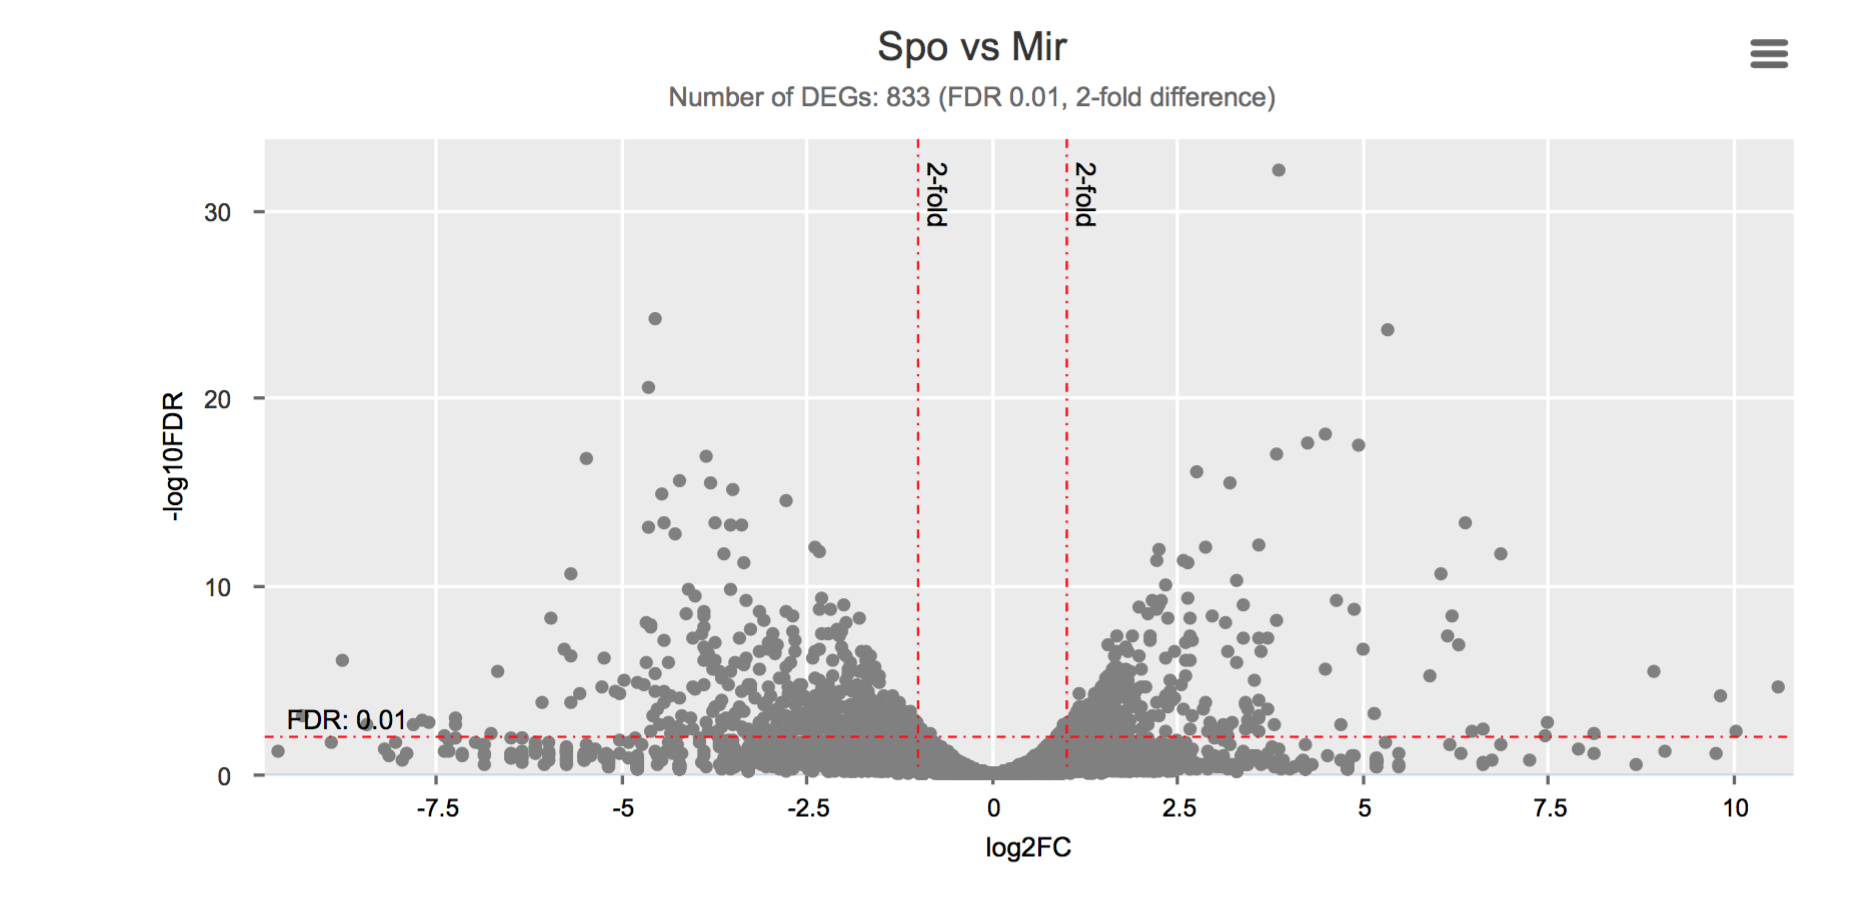
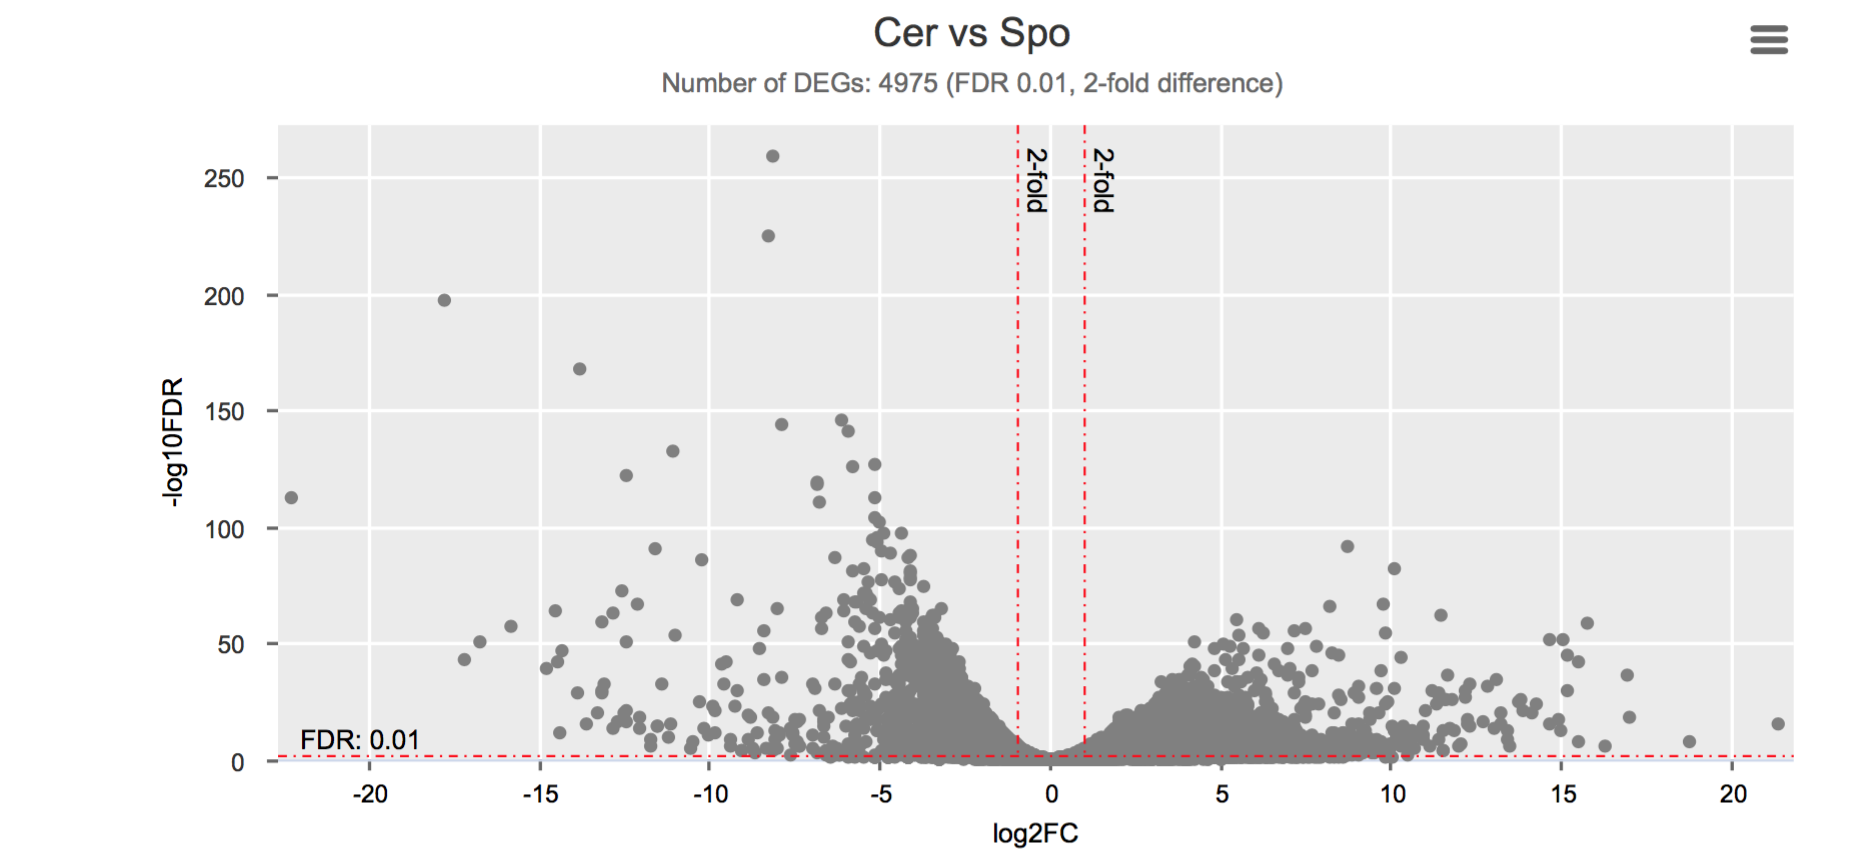
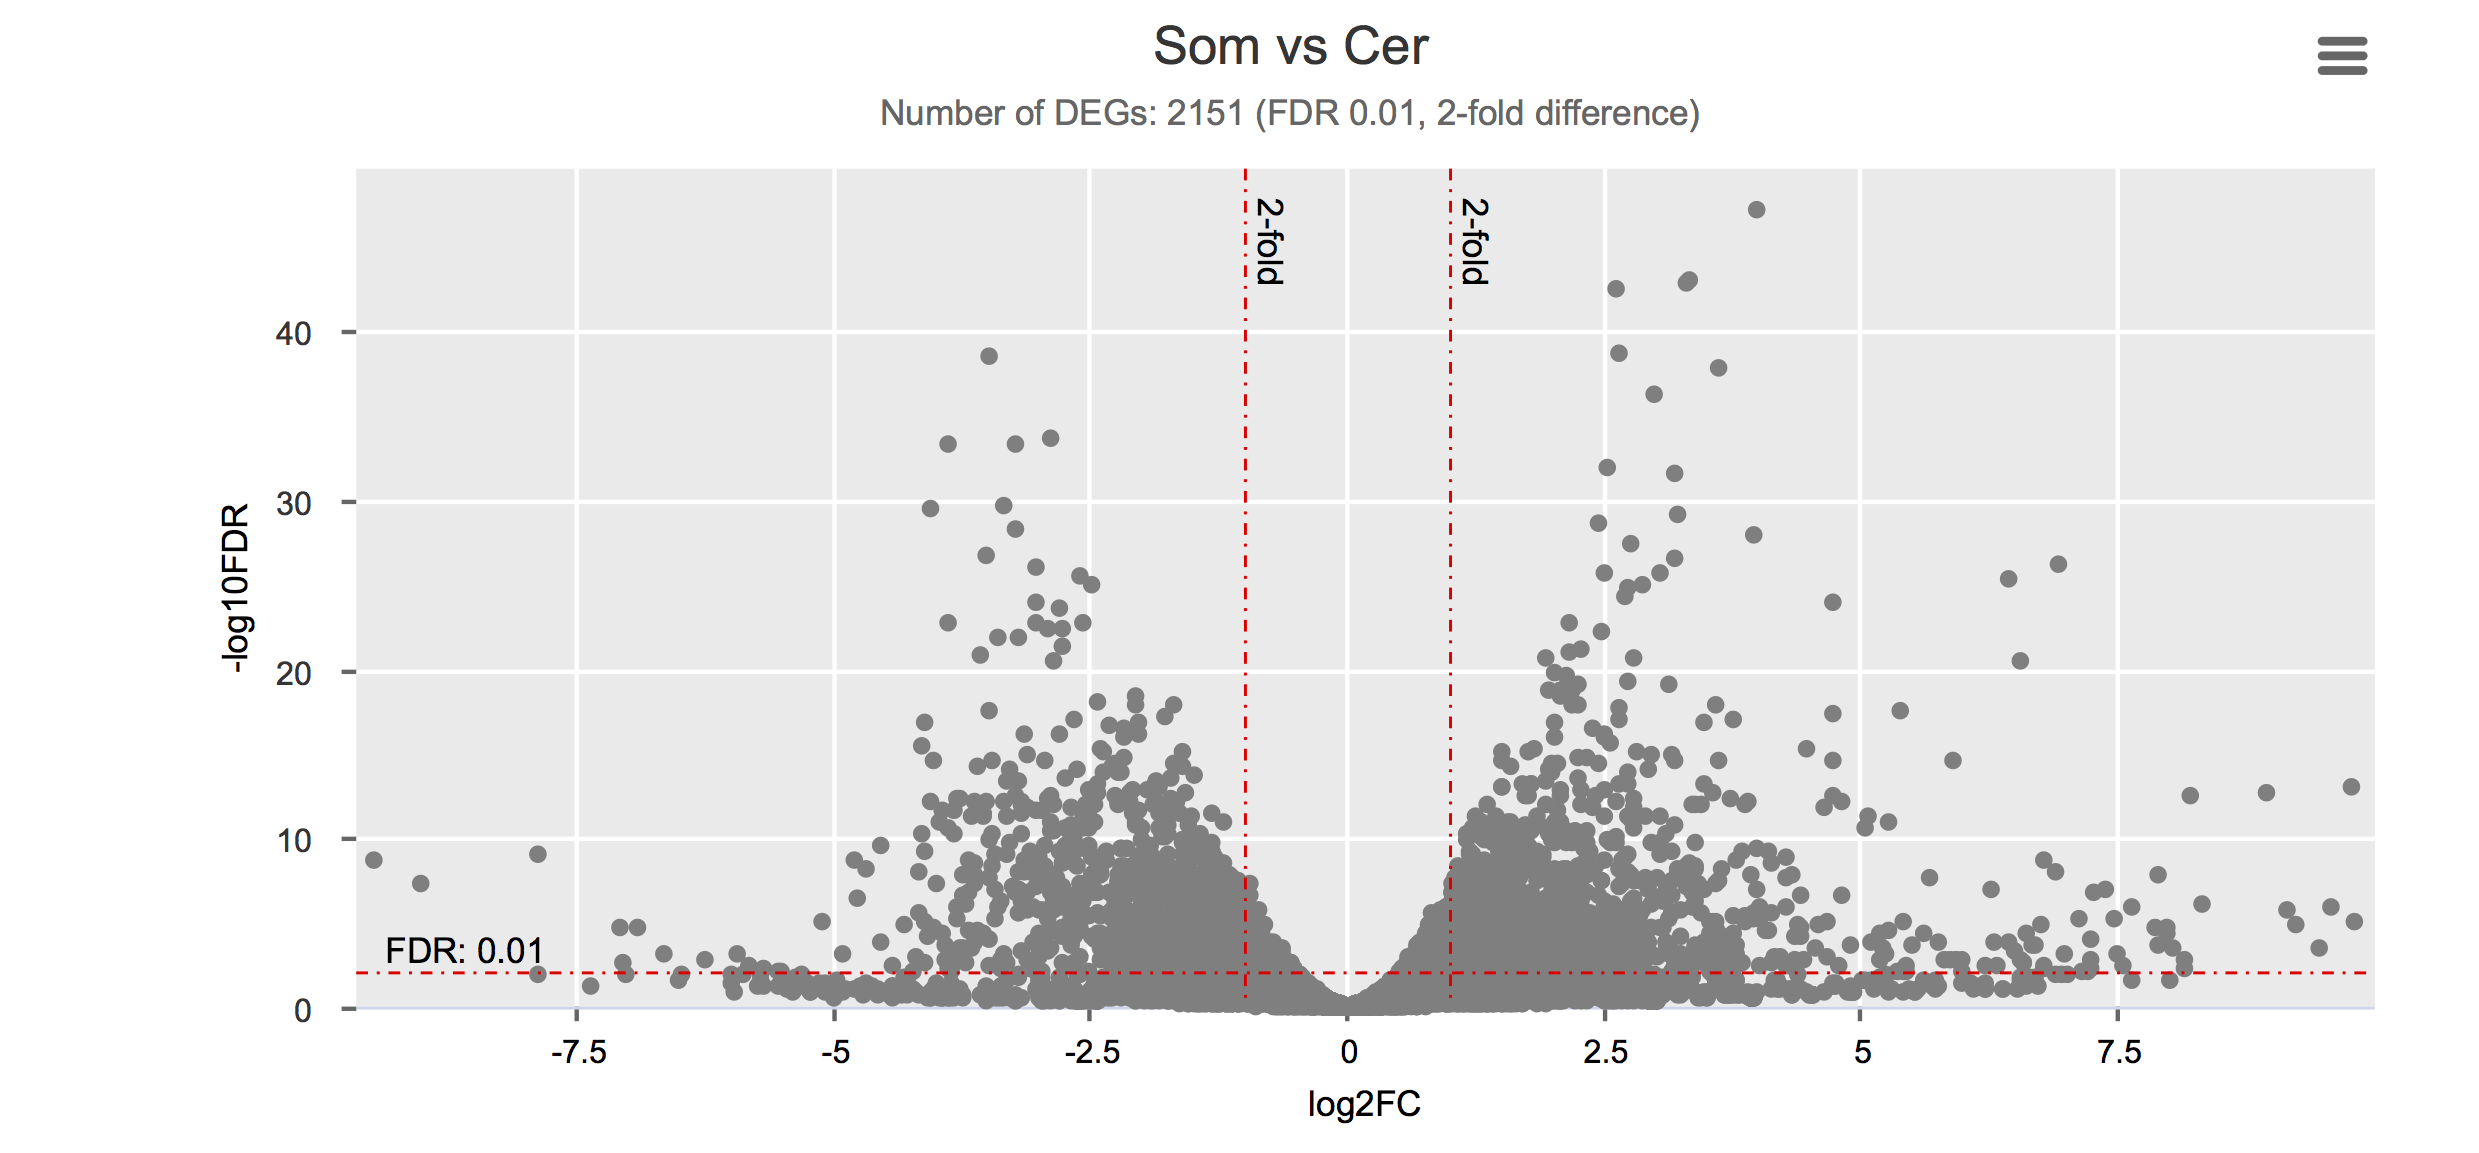
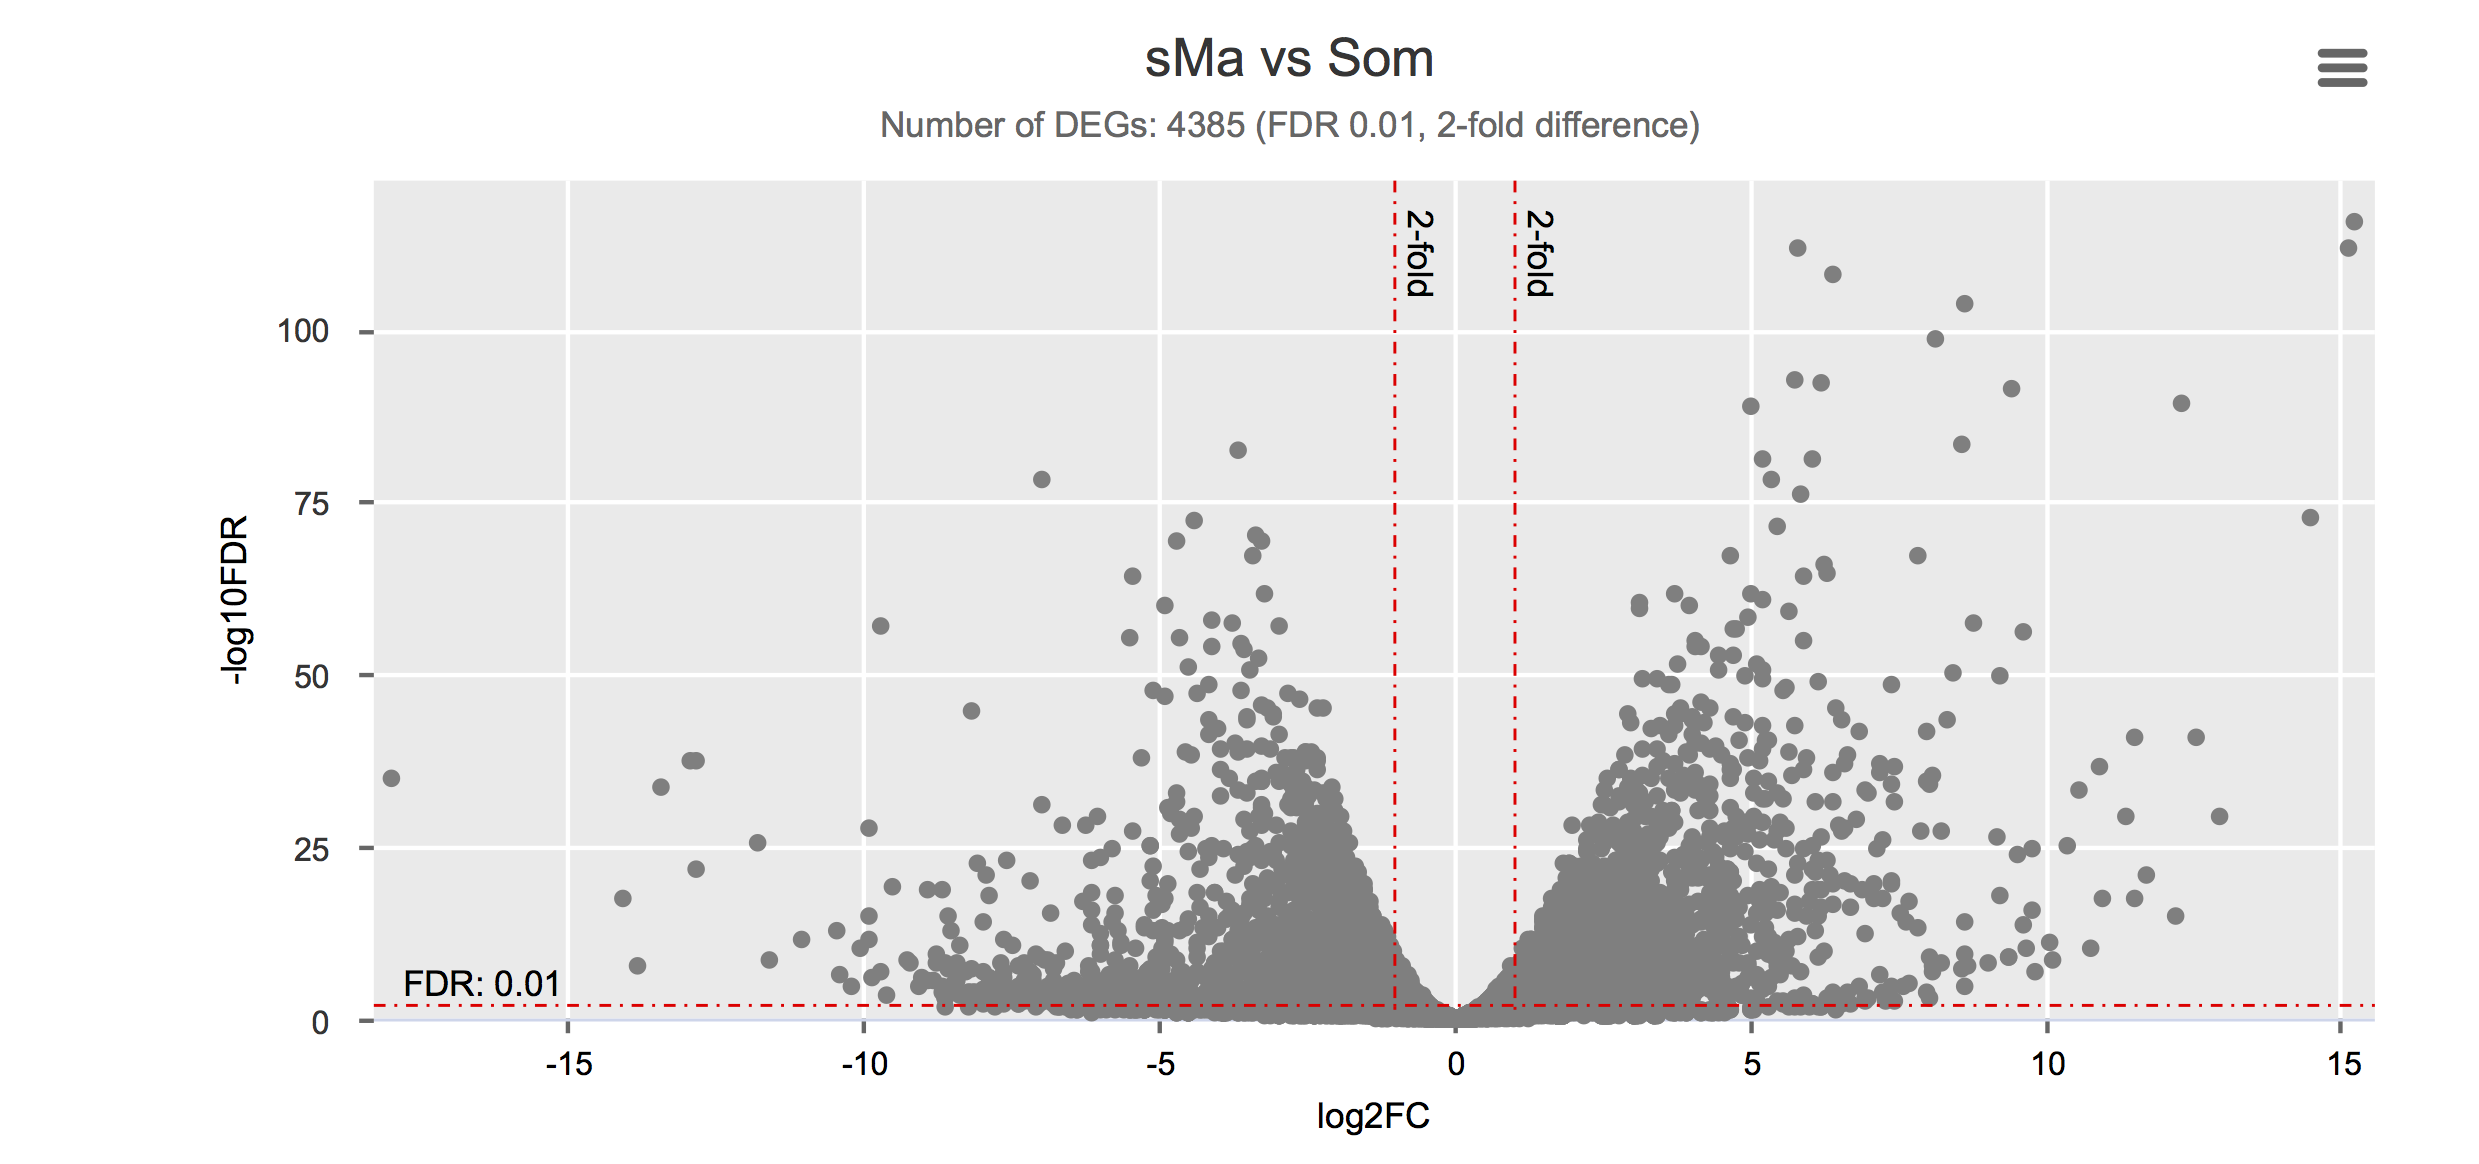
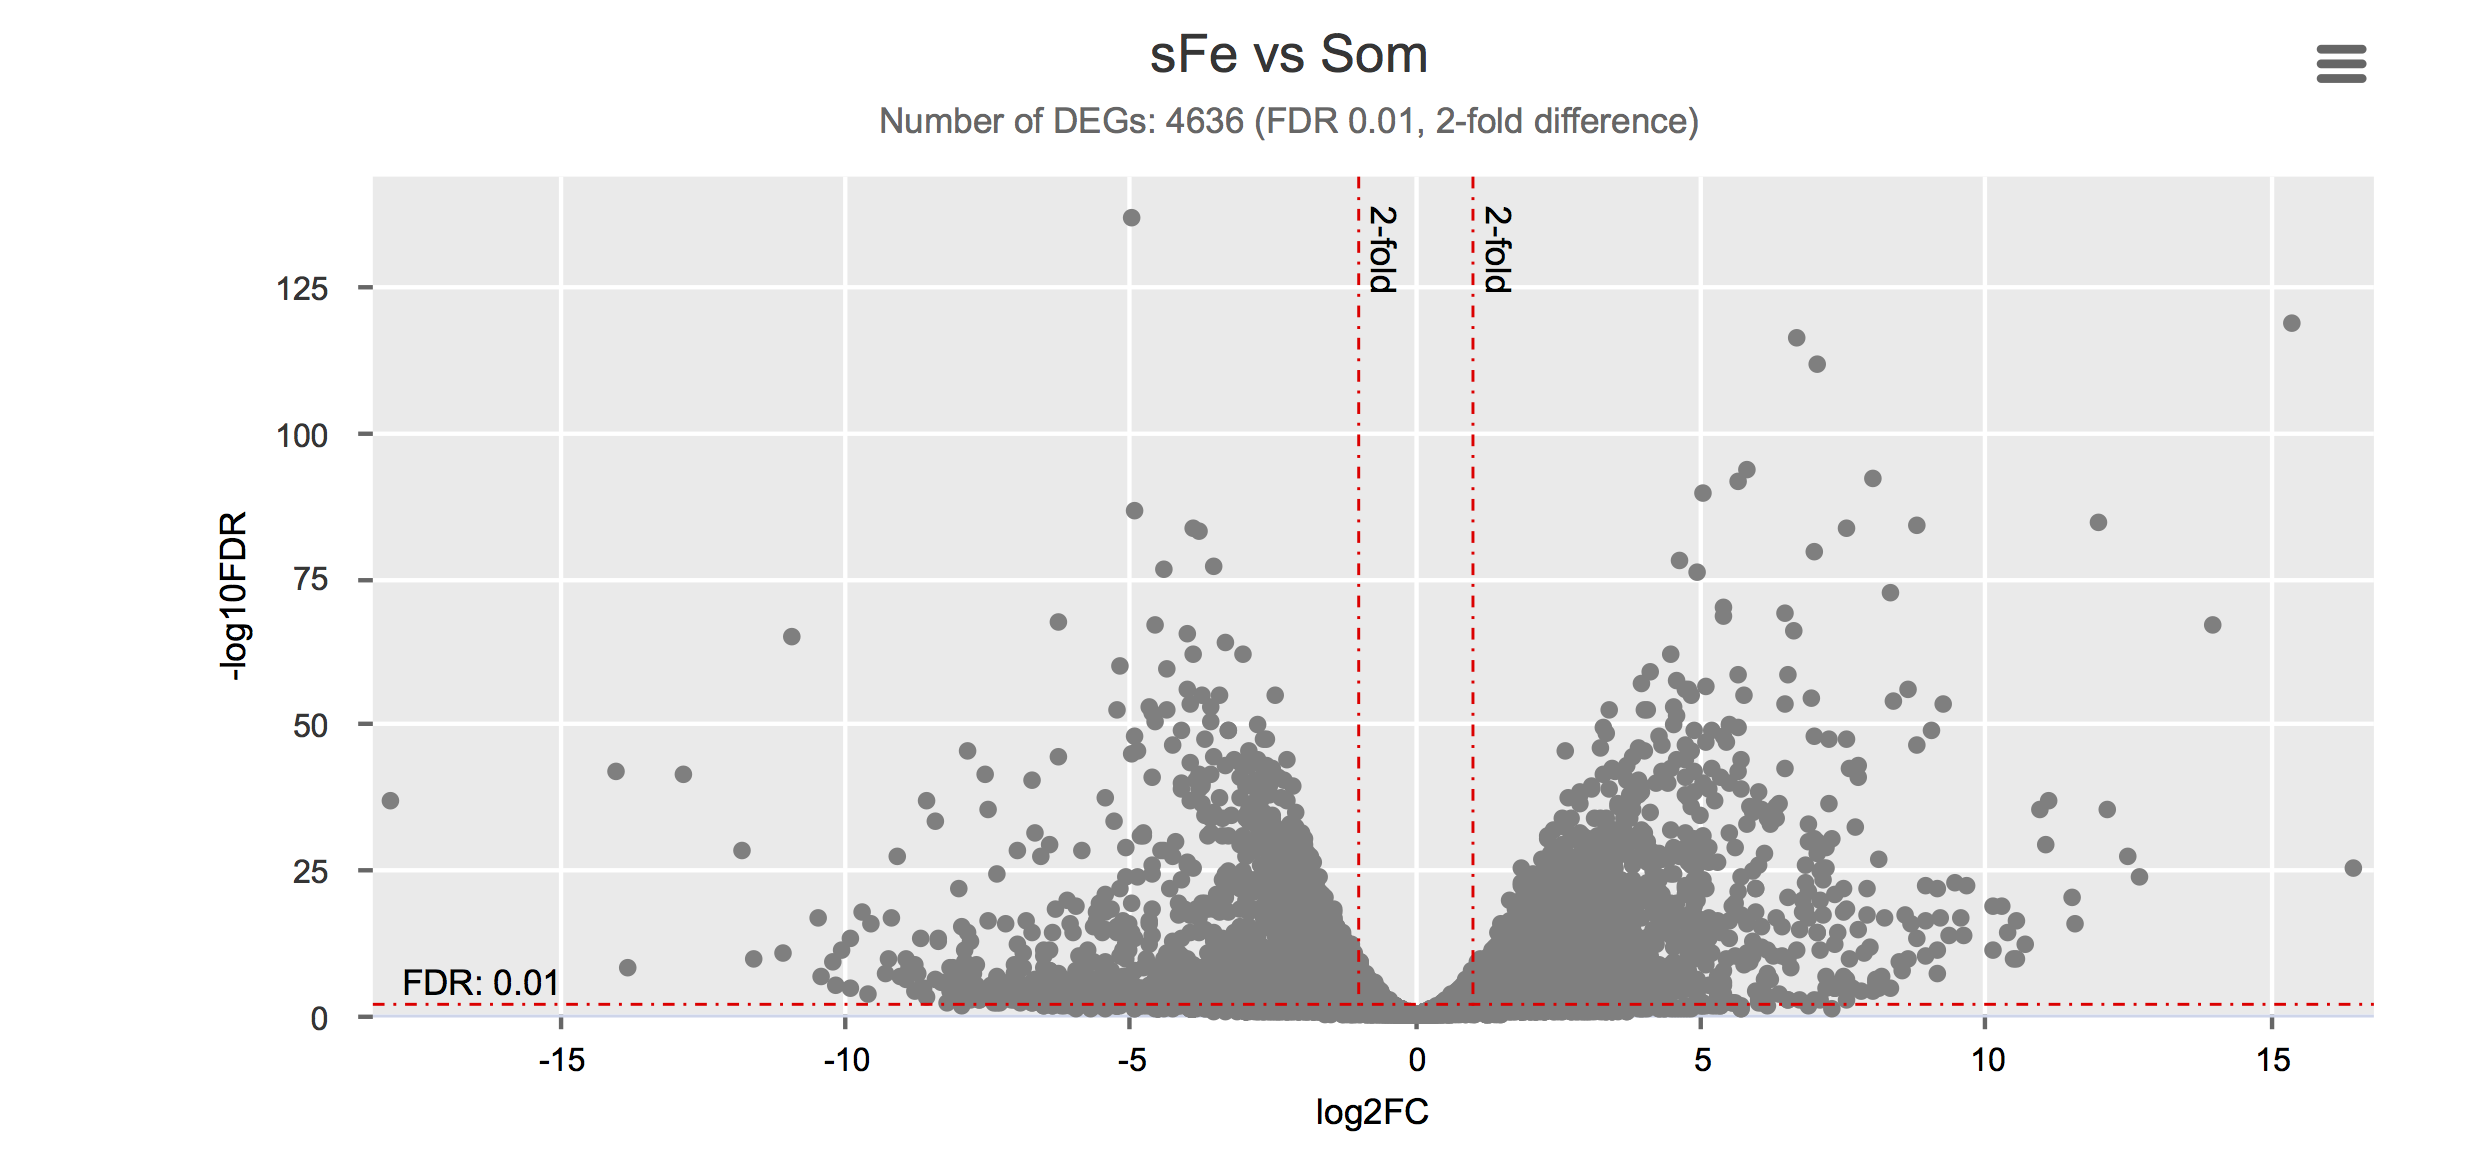
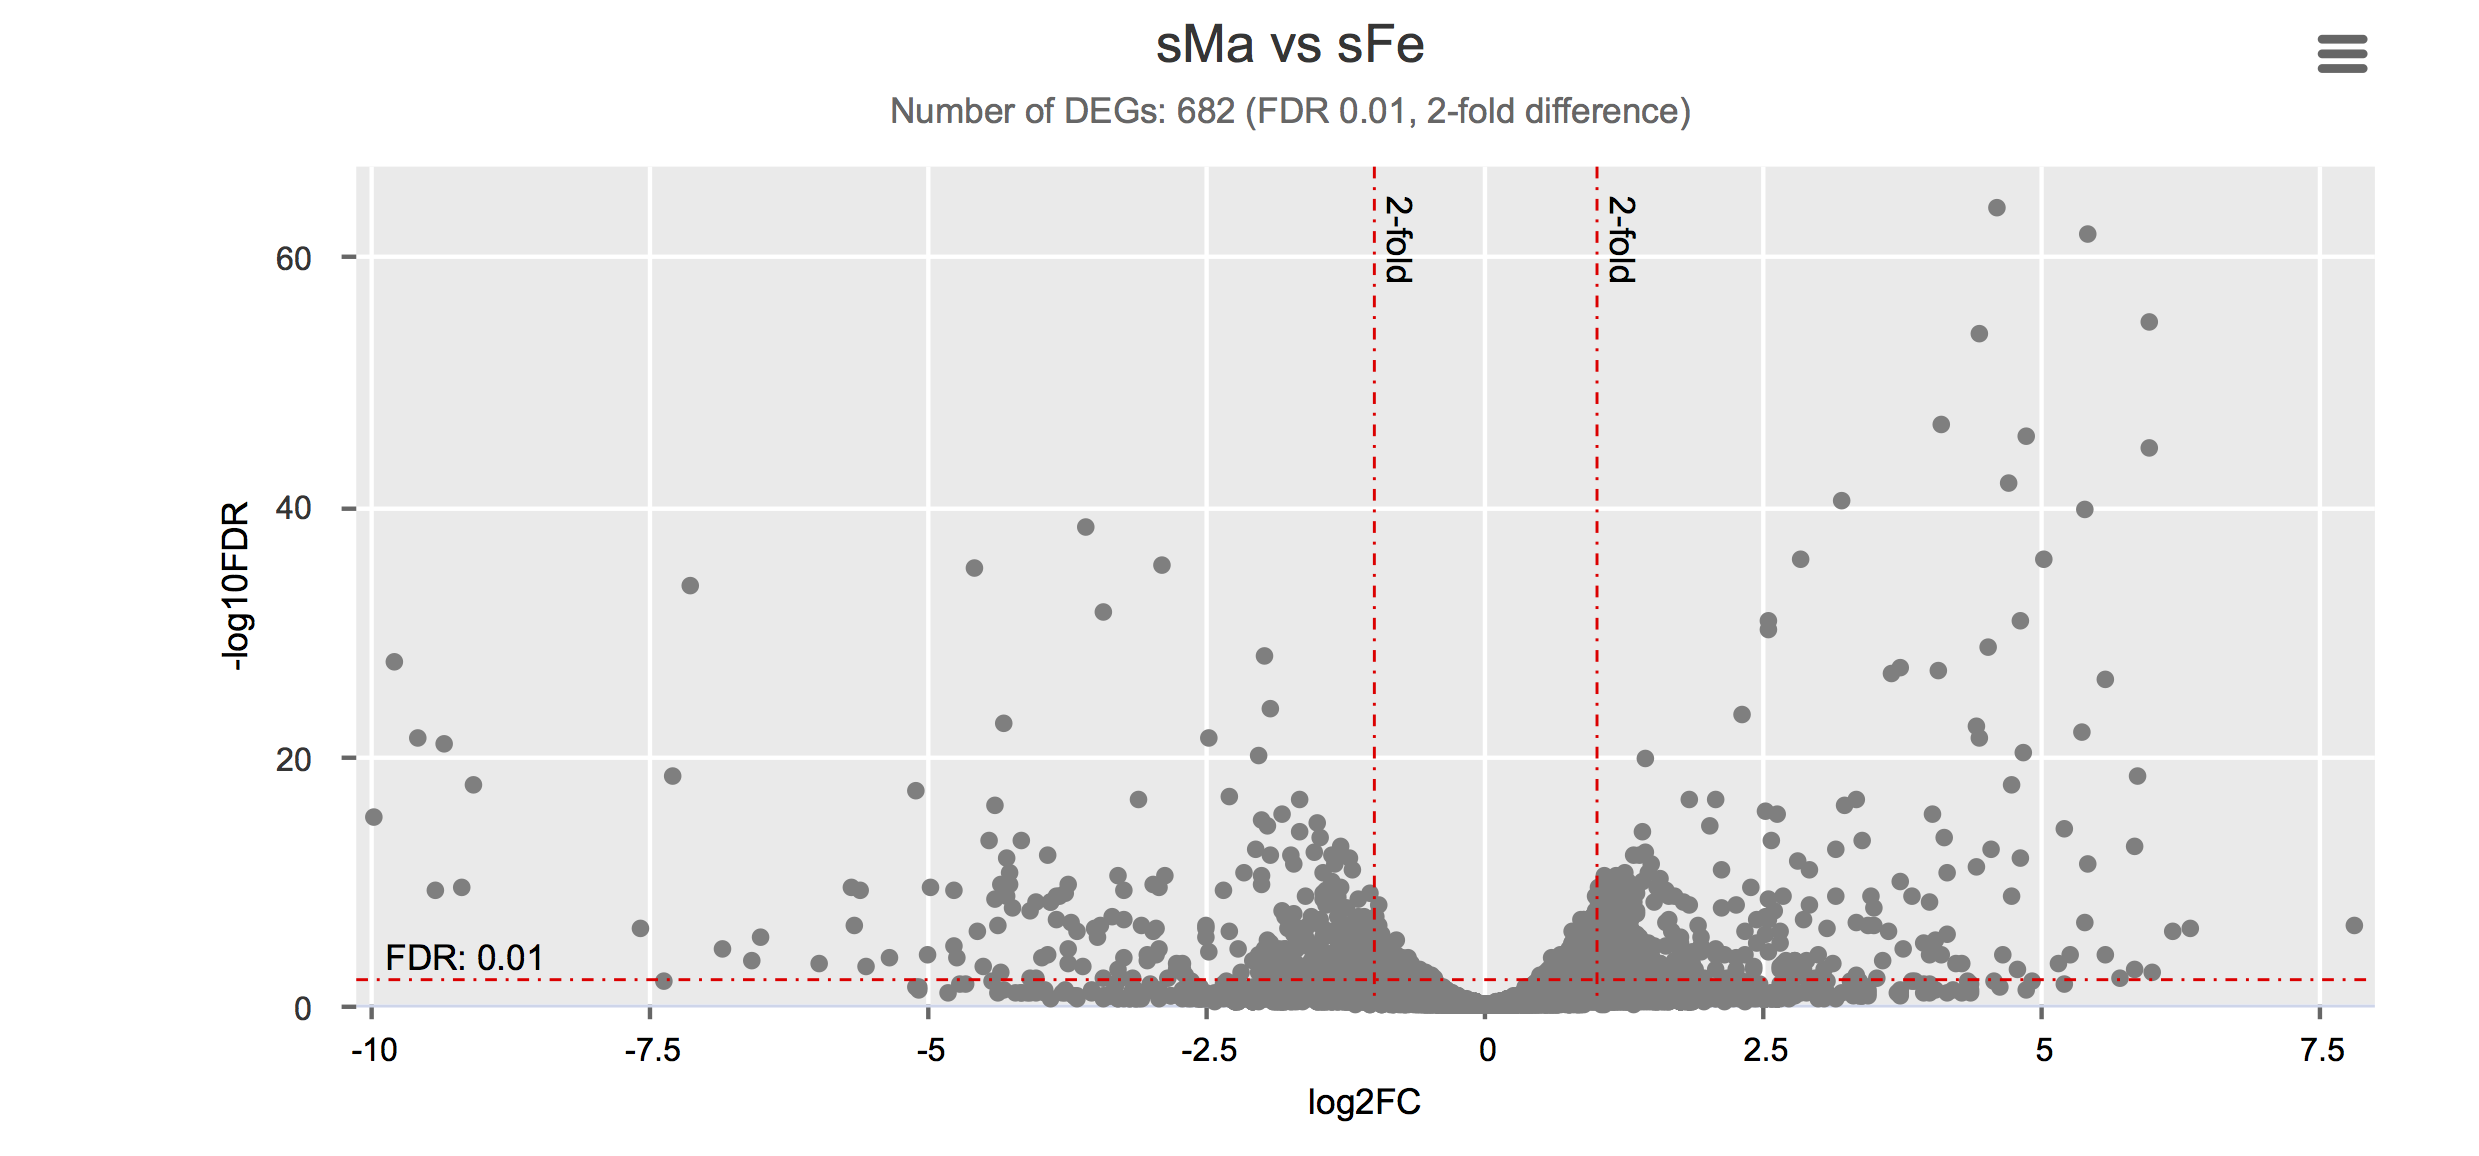
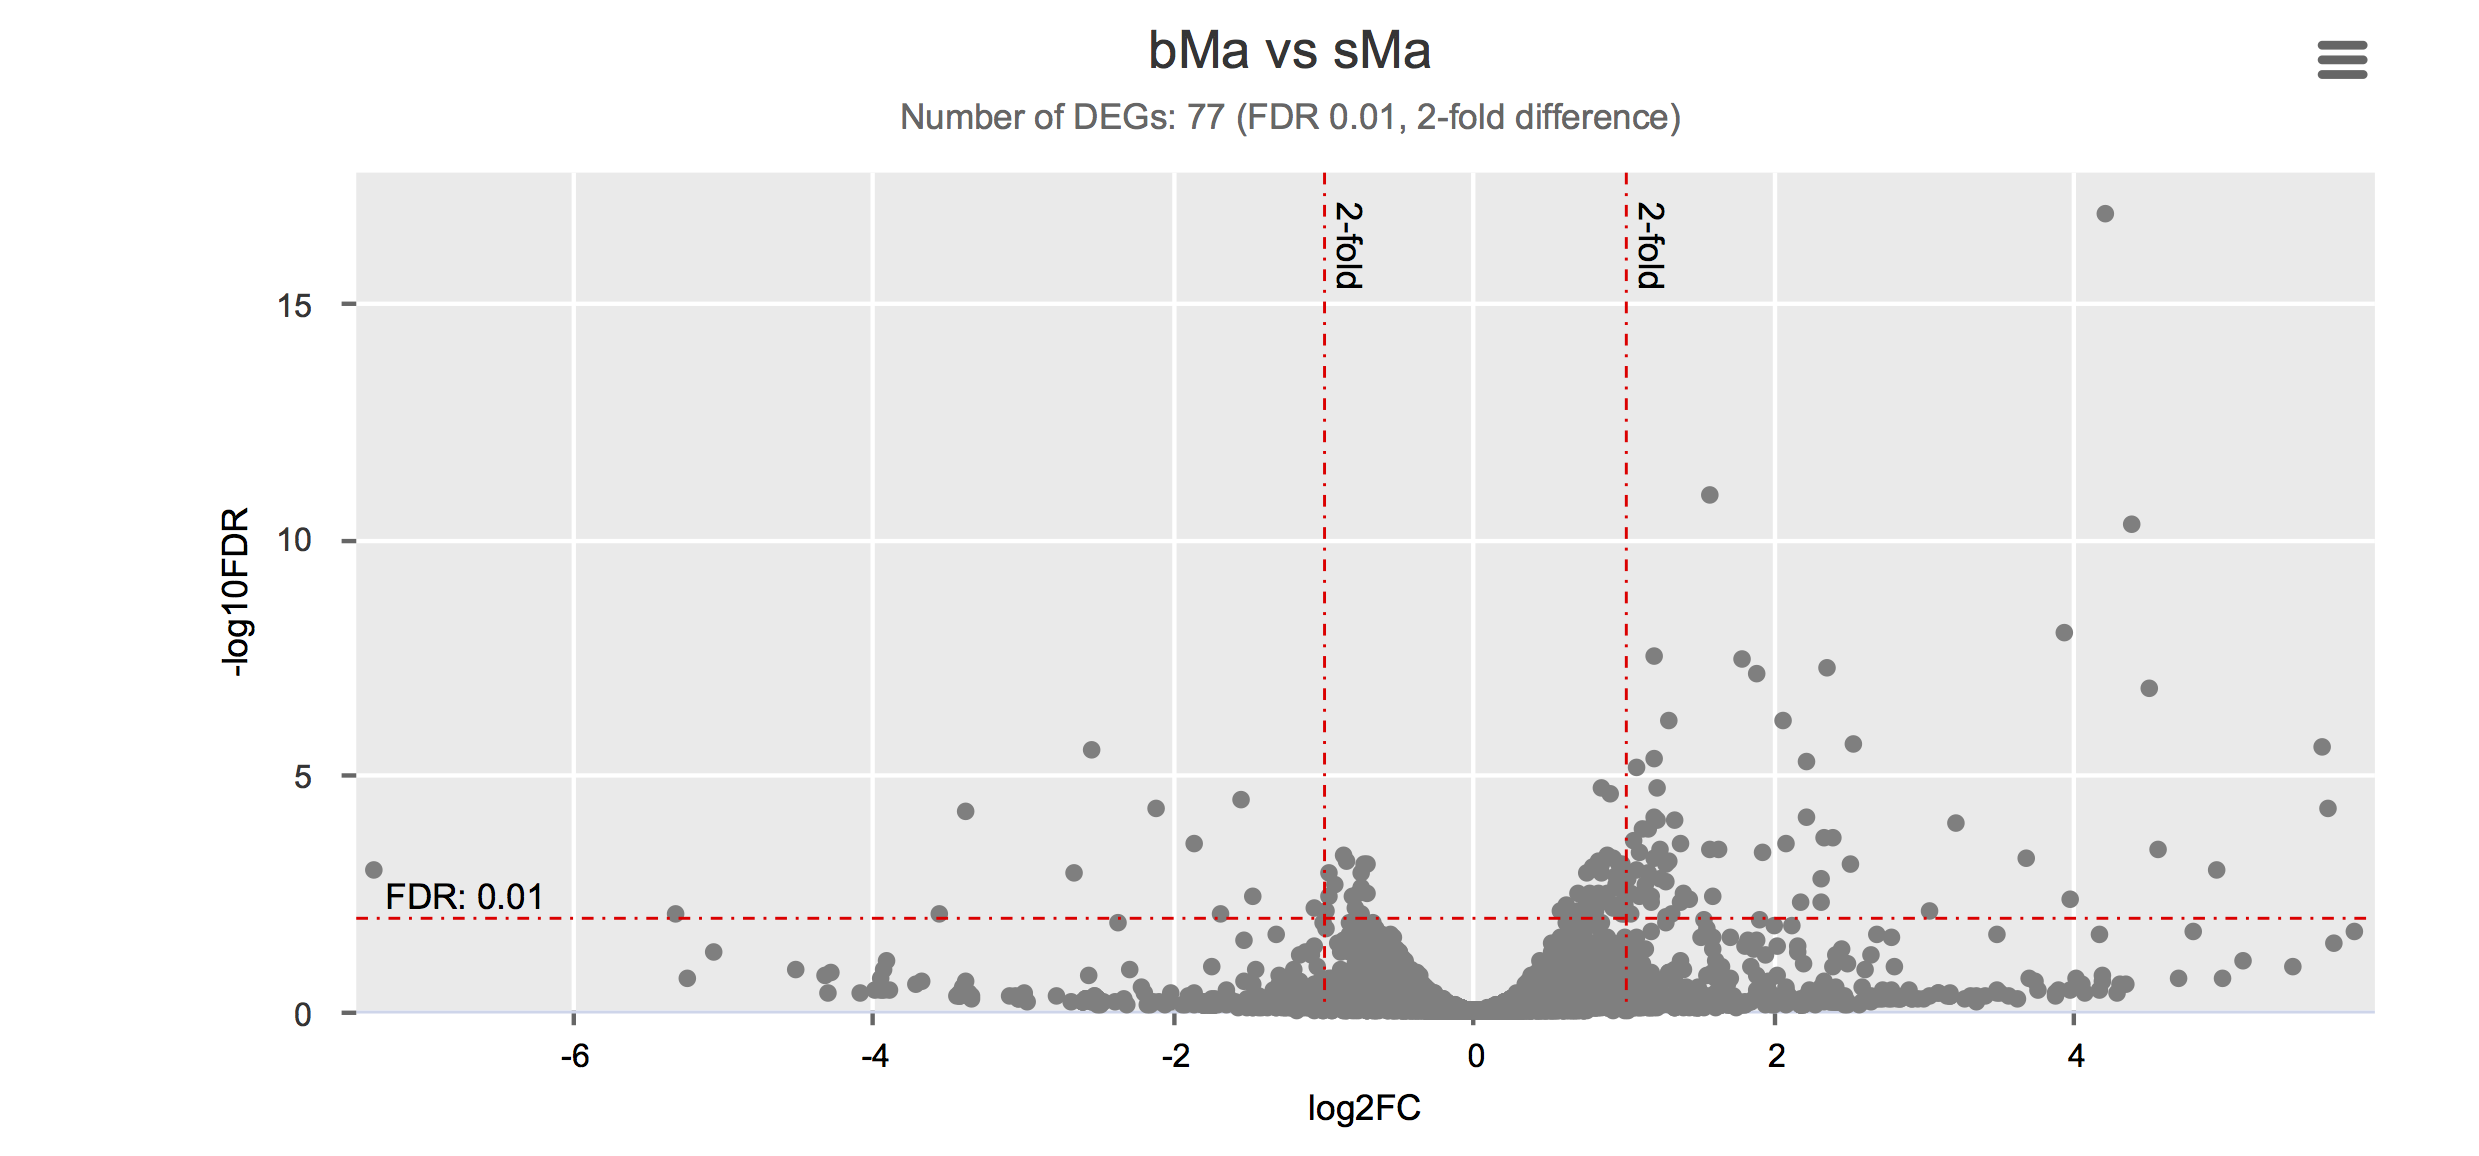
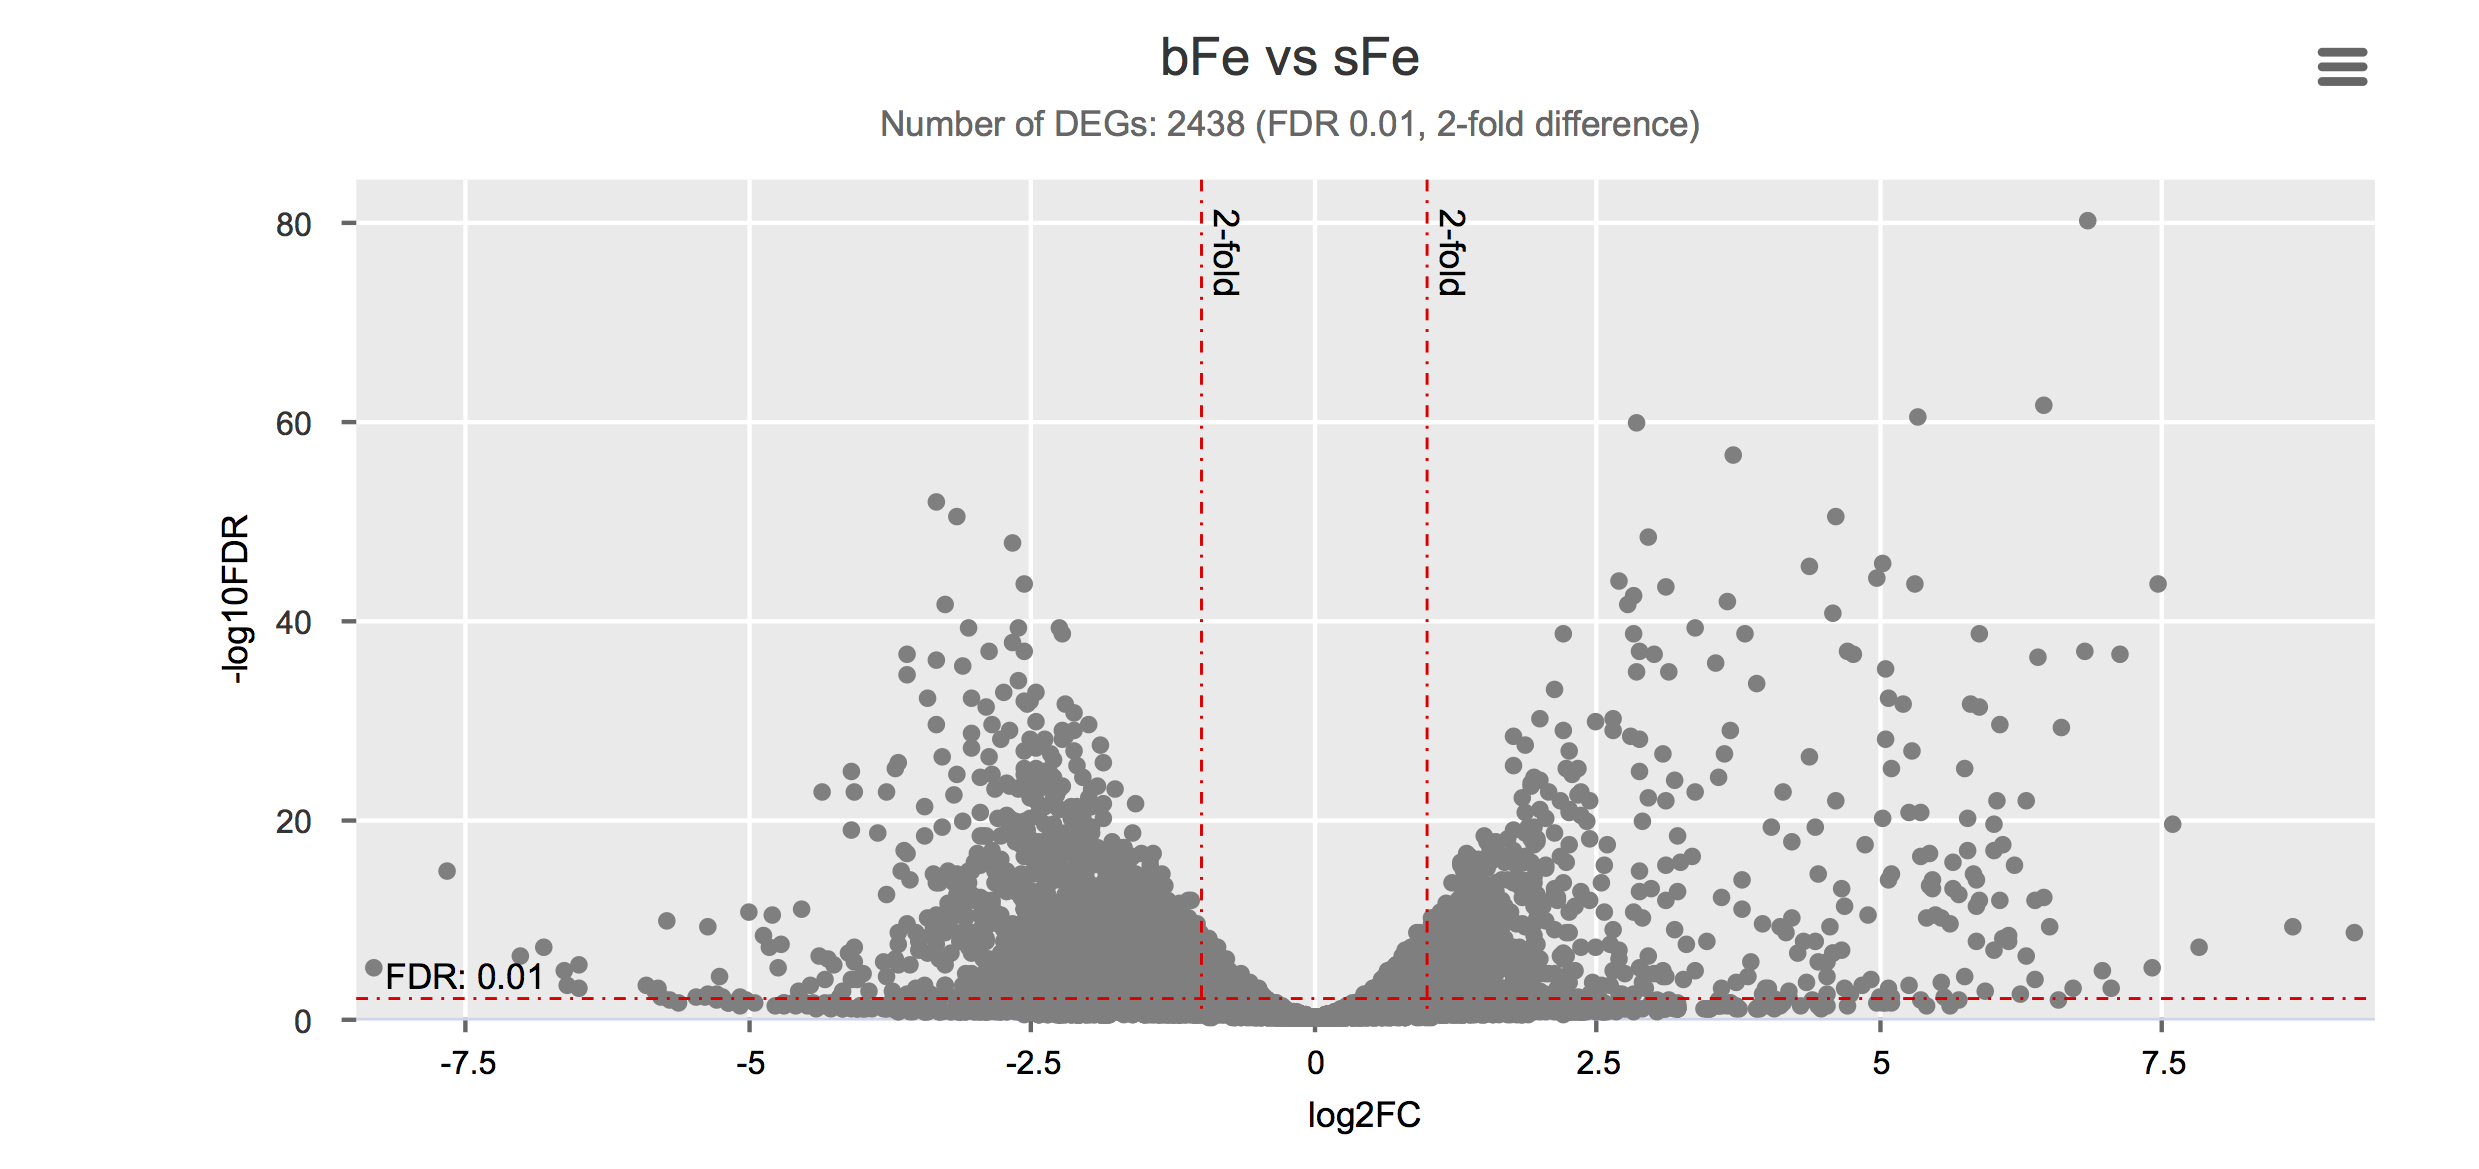
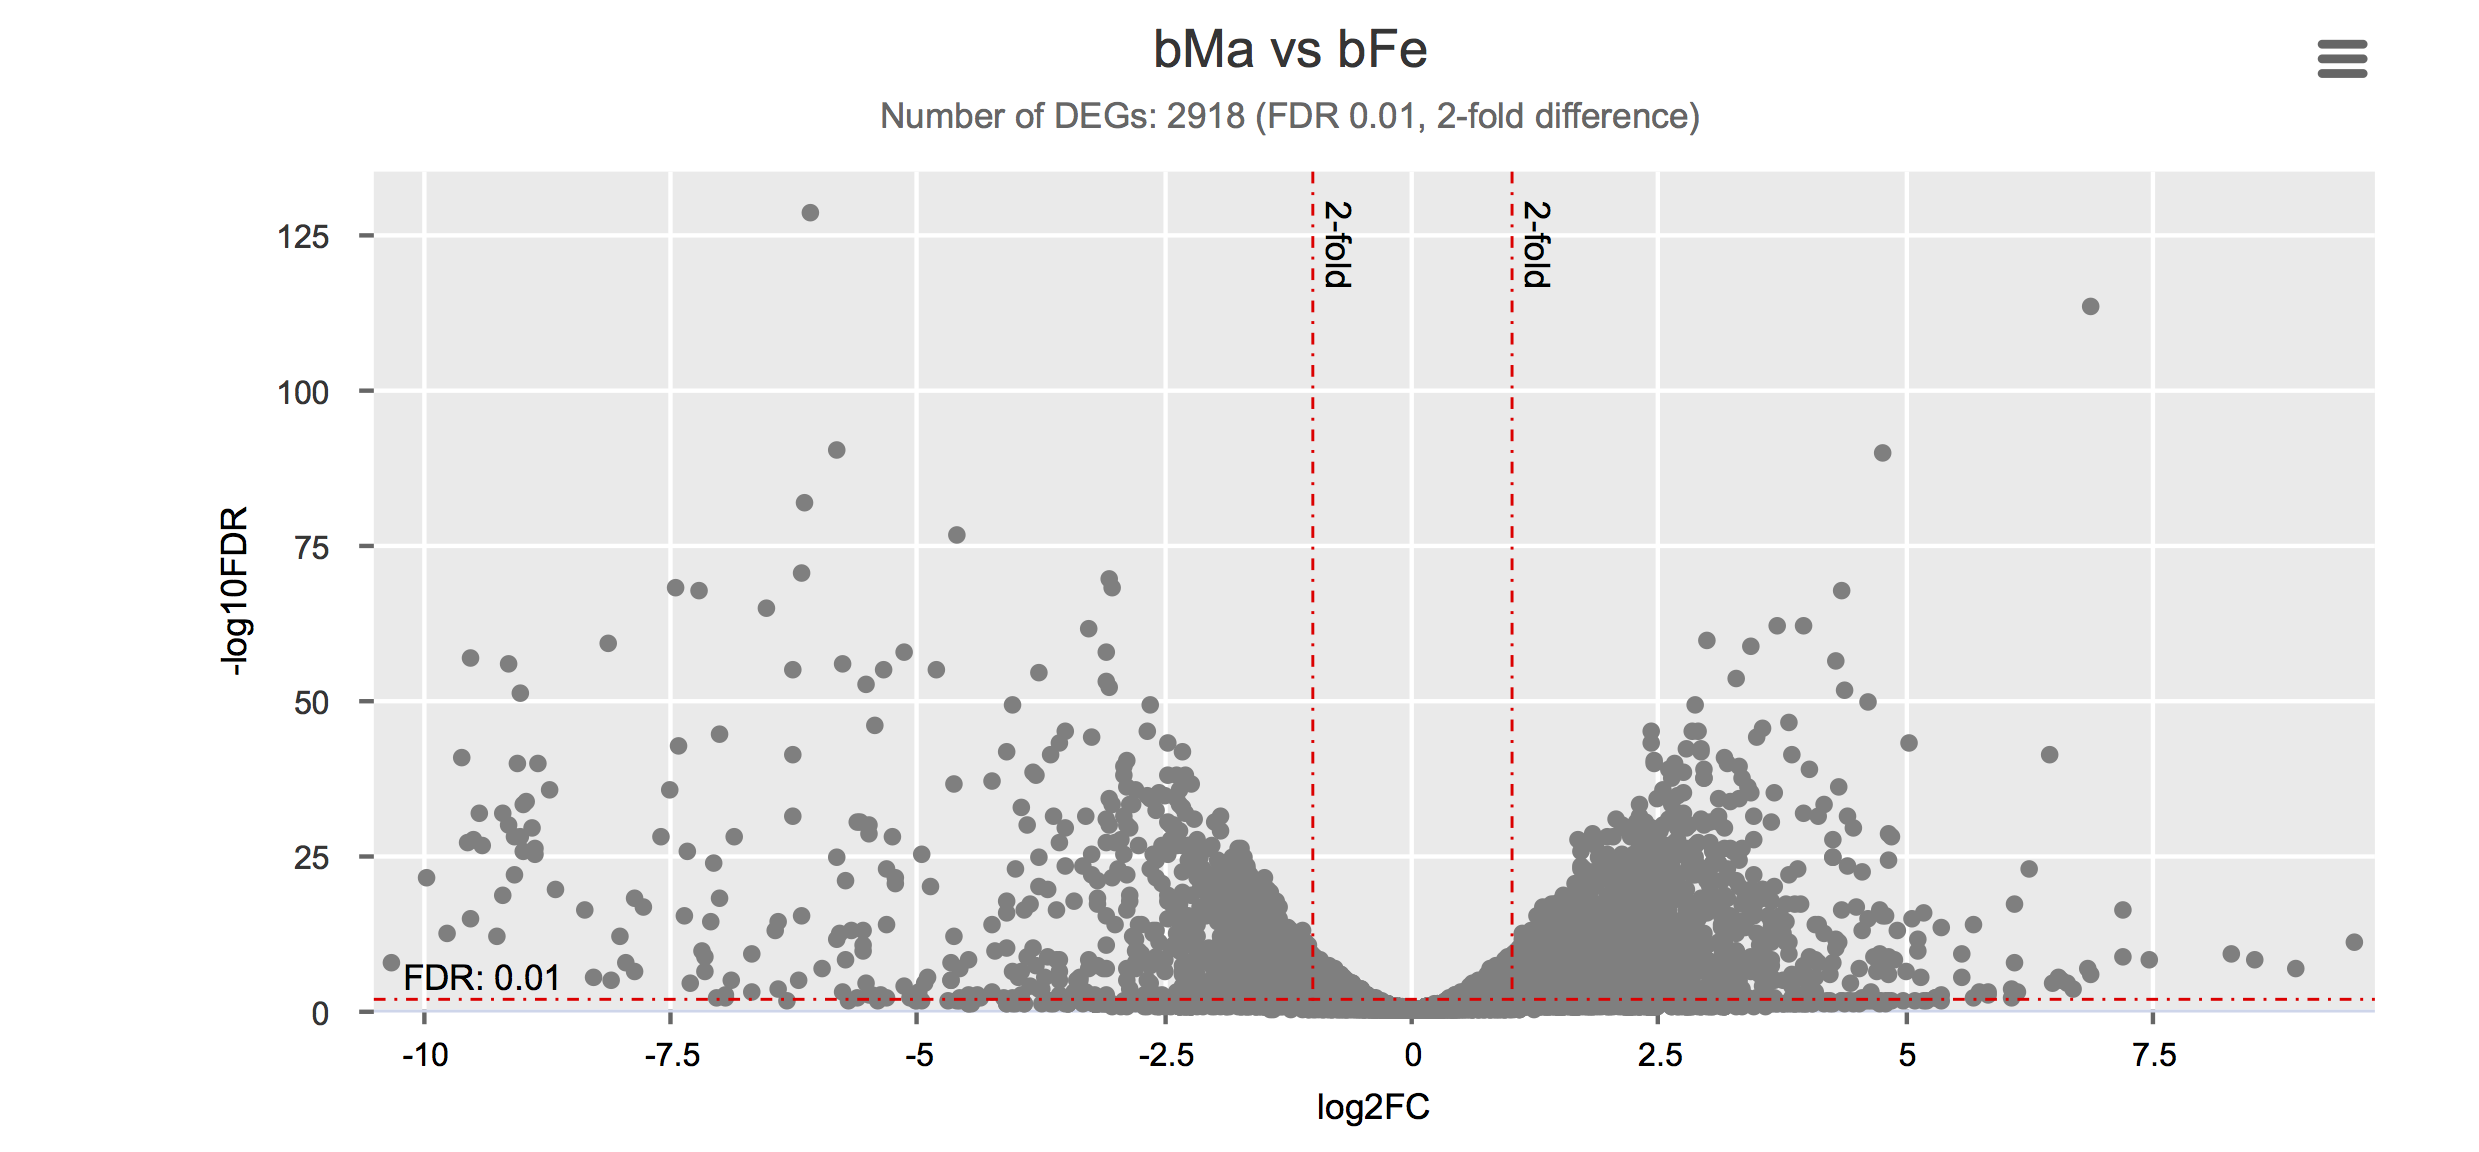
Differential gene expression
Click on each figure to see the interactive logFC-logFDR volcano chart. I did but it’s generally not recommended for samples without biological replicates.
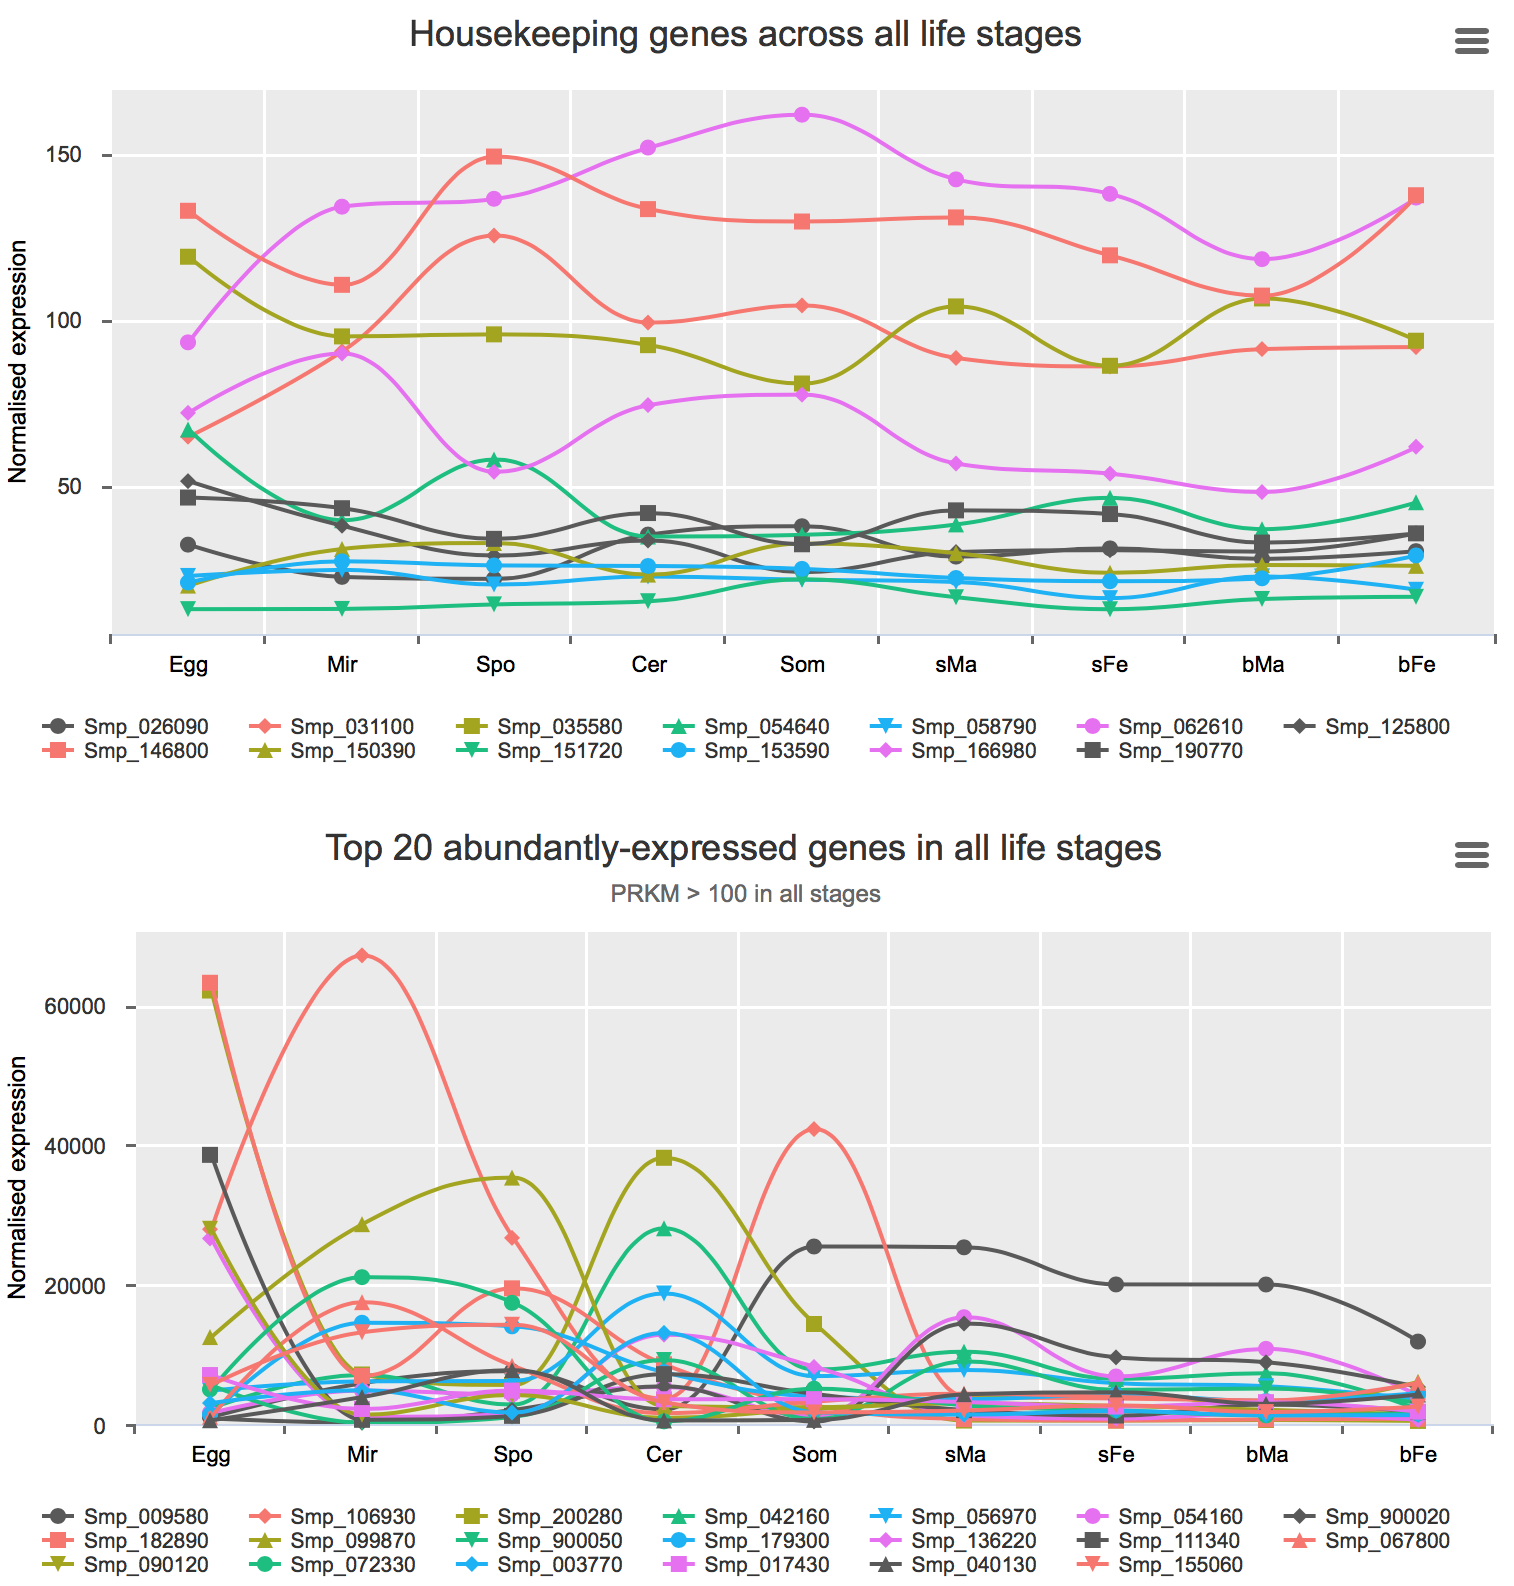
Housekeeping and most abundant genes across all life stages
Housekeeping genes were discovered with two methods:
- using the GLM approach (edgeR) and set fold-difference < 1.5 between bFe and any other life stage.
- using the R package Normfinder and select those with lowest stability values.
Most abundant gene transcripts were calculated by ranking the mean expression values (before normalisation) of all samples.
You can find the interactive charts here.
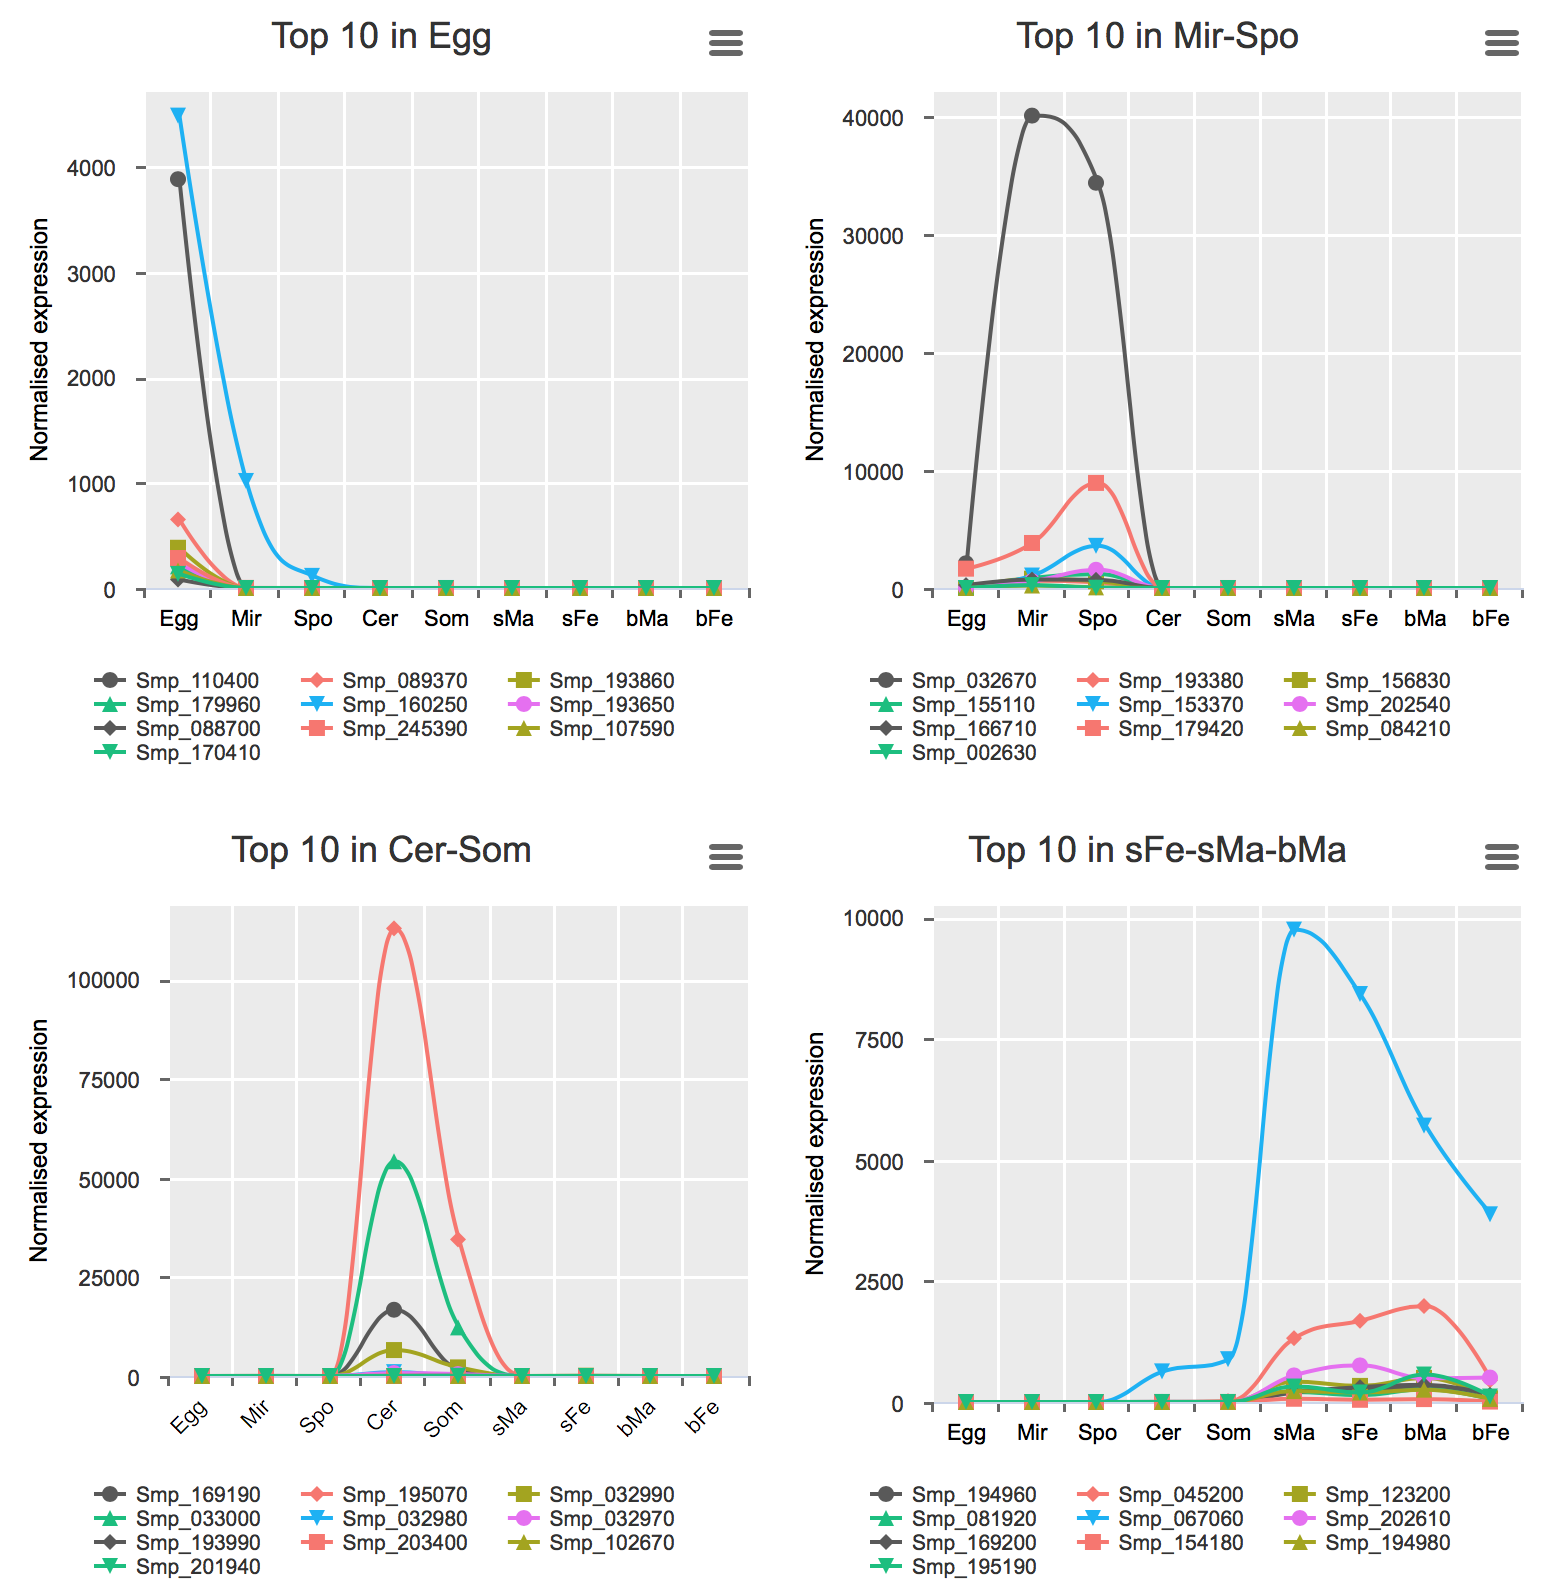
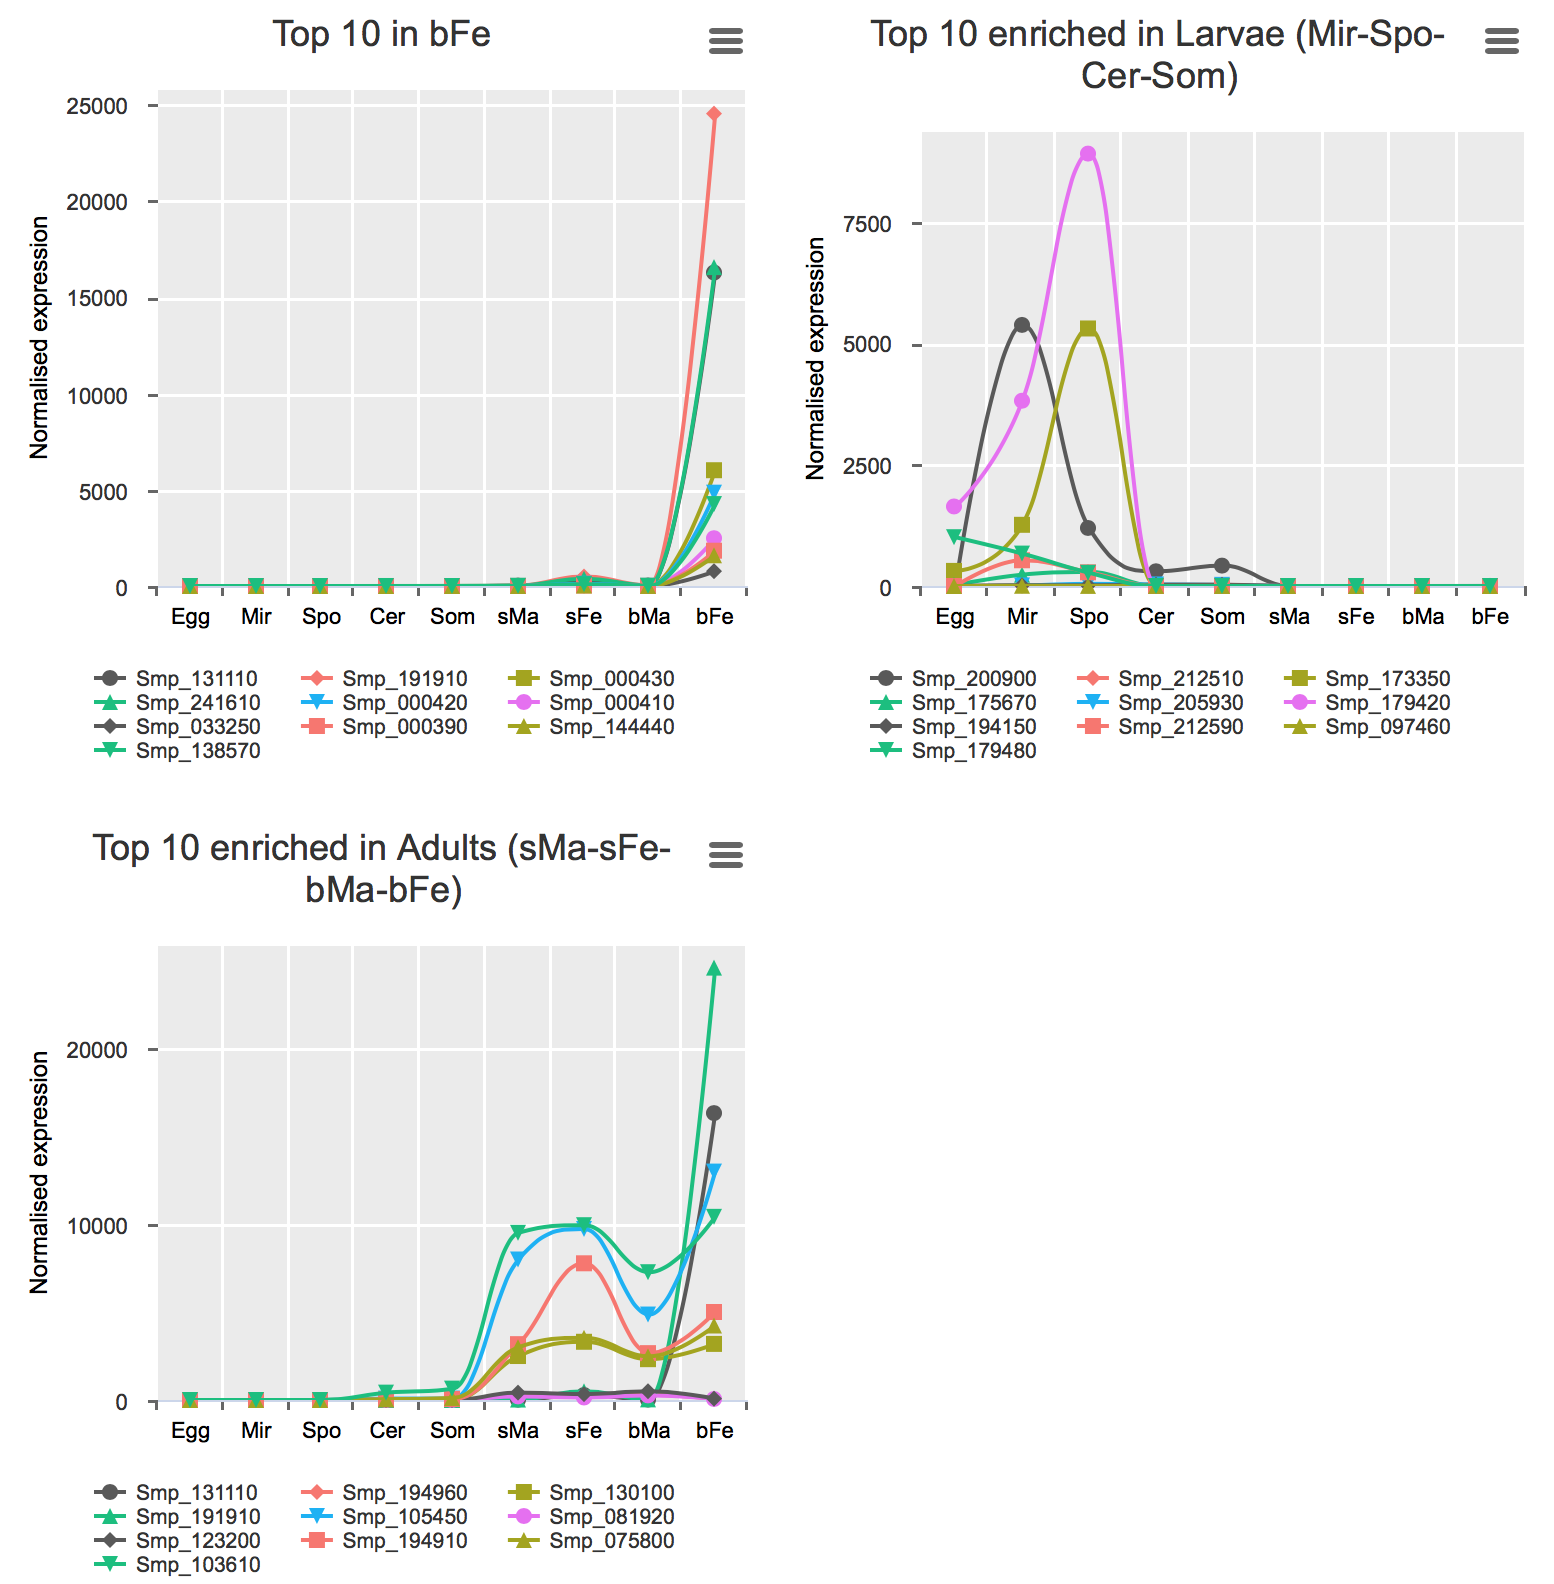
Genes preferentially-expressed in certain life stage(s)
These analyses were performed for all stages excluding bTe and bOv (Details).
Preferential expression was calculated using GLM approach to compare the expression of one stage to the average of the rest (FDR < 0.01 & higher expression than any other stage).
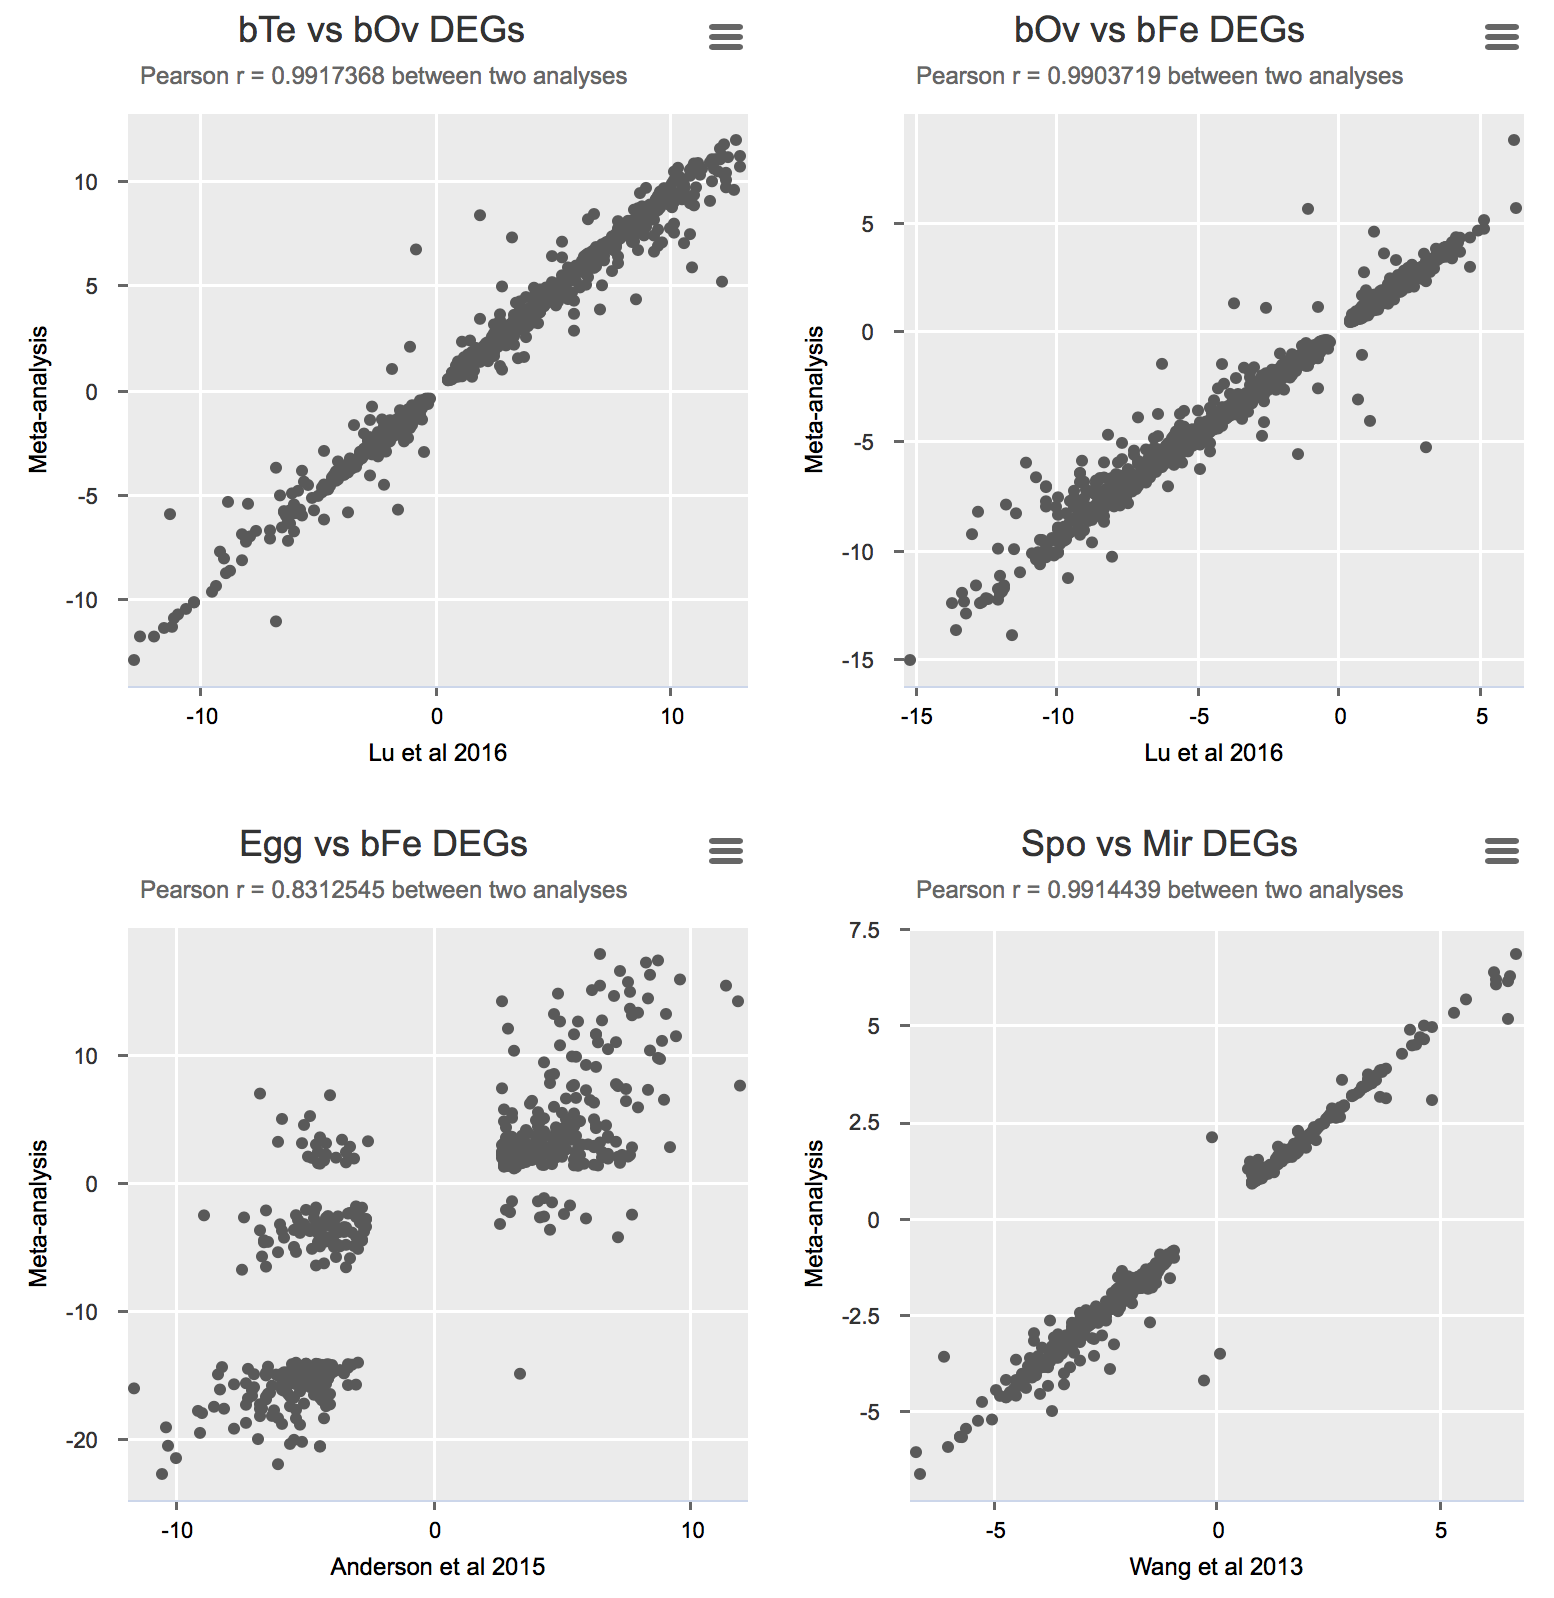
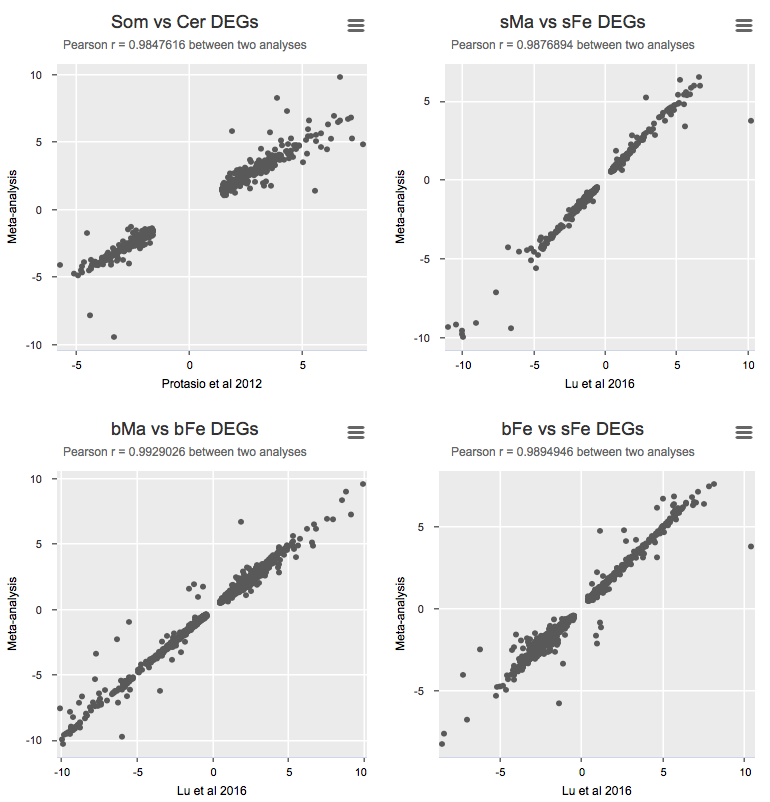
Validation
To validate the meta-analysis, I selected differentially expressed genes (FDR cutoff 0.01) and calculated Pearson correlation for logFC between the original study and the presented meta-analysis (Details).
Some notes
- TMM (Trimmed Mean of M-values) is a batch normalisation method (on a group of samples) [return]
- Similar to pairwise comparison. From the edgeR Users’ Guide: “The glm approach to multiple groups is similar to the classic approach, but permits more general comparisons to be made.” [return]
- I prefer RPKM over normalised counts because you can compare between genes (although it’s different from the original RPKM) [return]
- PCA: the separation of different clusters seems to make biological sense [return]