ABOUT
This section contains some hints on using the web portal and acknowledgements.
How to query your gene of interest
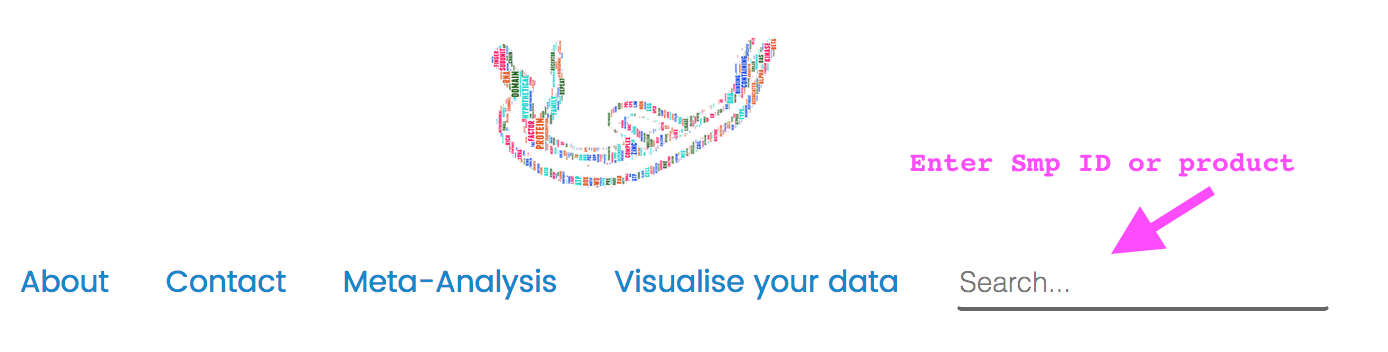
The search box has been implemented in the main page, and on the top right menu of ant other page. You can enter the full Smp id (e.g. Smp_000080) or keyword in the product description (e.g., receptor). Please note that this is exact search and you have to enter the full word. For instance querying “hypo” will not find product names with “hypothetical”. Please also note that you have to enter at least 3 characters for searching.
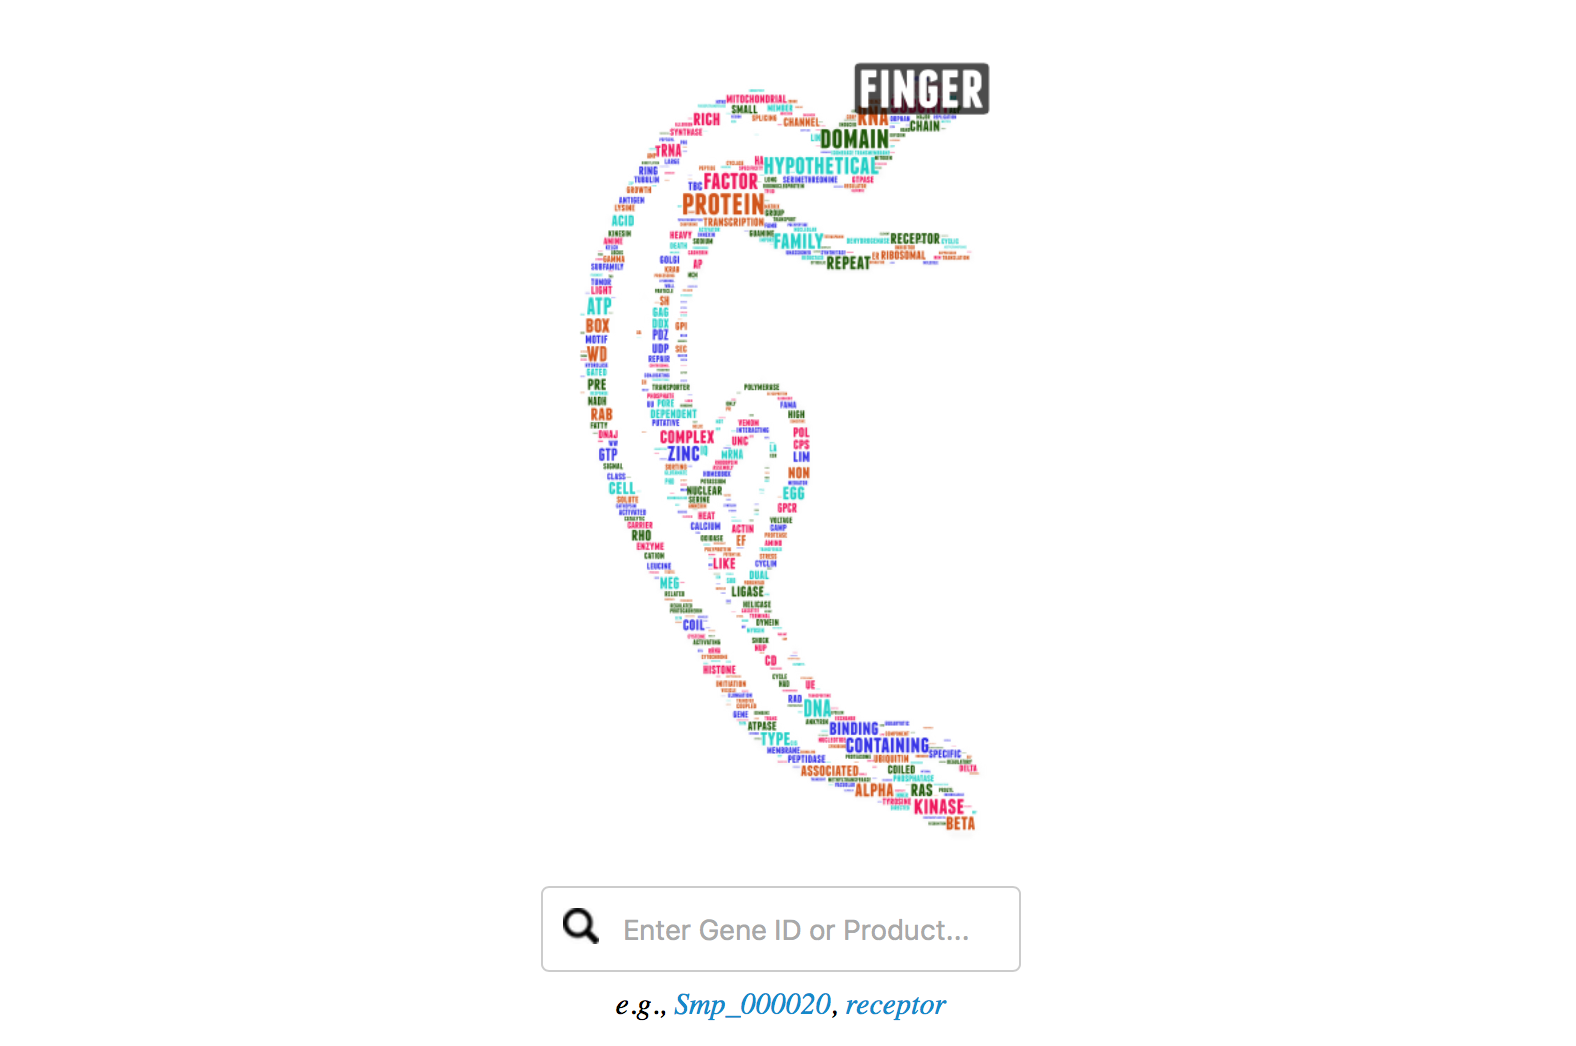
For querying product names, you can also click on the keyword in the word cloud image (it is fun) of the main page. This will lead you to the search result page with that keyword as query.
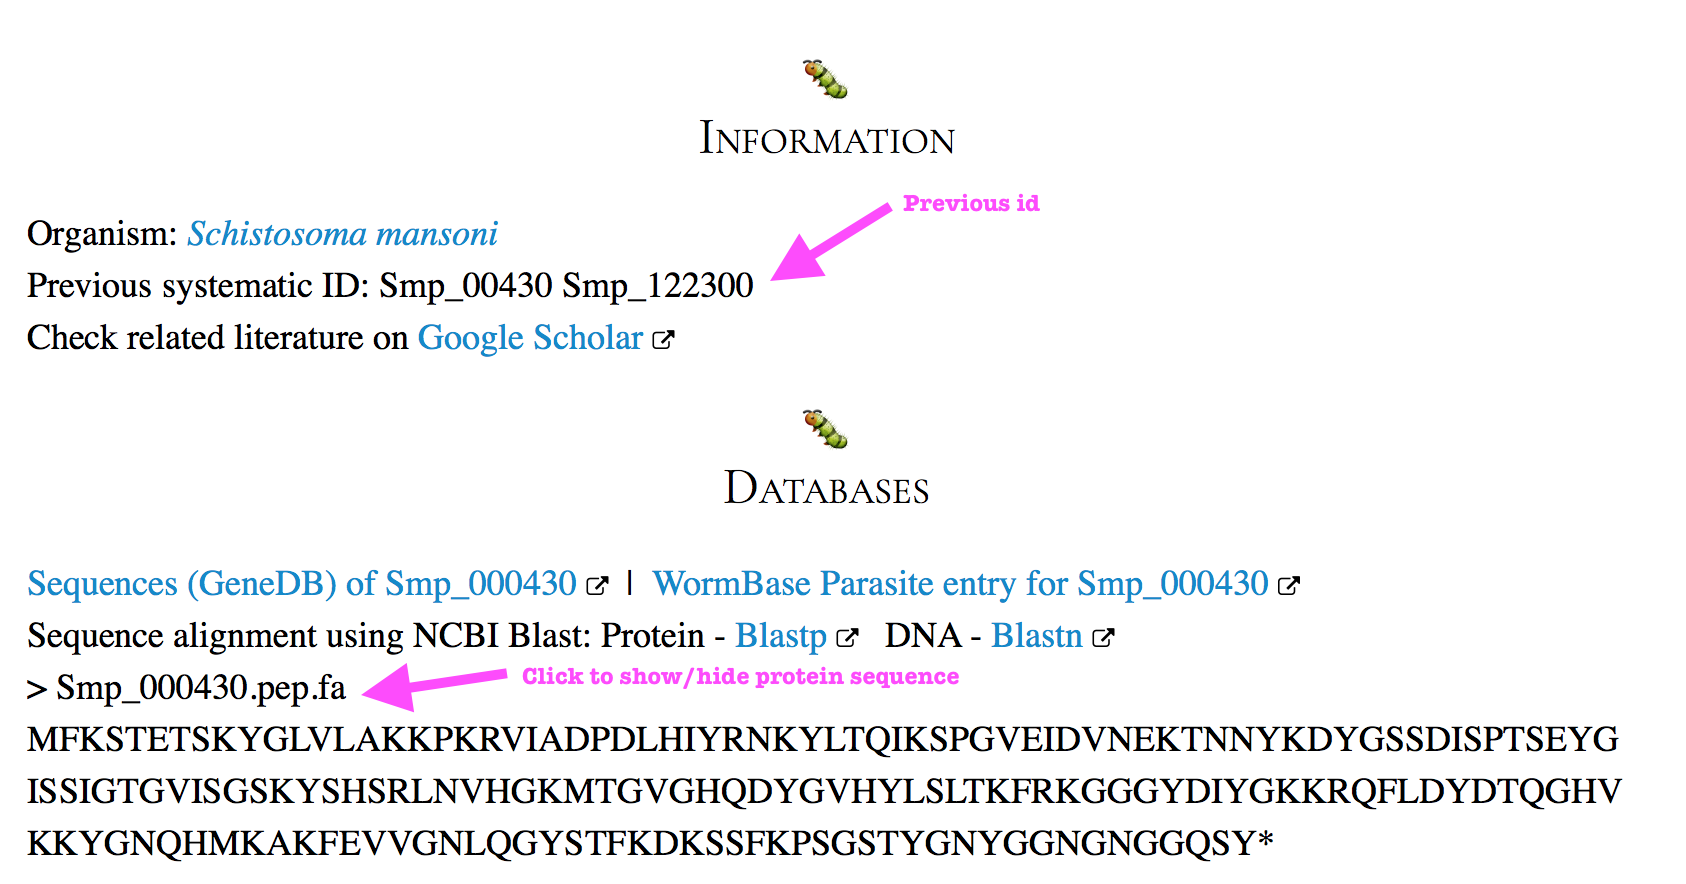
If the ID of your gene of interest has been changed on the latest annotation, the search will show you the gene with a newer ID, and when you open that gene page, you can notice there is one line indicating “Previous systematic ID:“.
How to get more details using the interactive visualisation
There are mainly four page types where you can see and use interactive visualisation:
The main page
This page has been implemented with a word cloud image, which was generated using all words in the product description of all S. mansoni genes. Common words without real meaning (e.g. and, of, in, with), or single letters (e.g., A, B, C) had been removed. The size indicates the frequency of the keyword.
You can move your mouse over the keywords in the “schisto body”, it will give you an enlarged view of the word, even for those you can hardly identify by eye. Click on the keyword will lead you to search results with the keyword as query.
Individual gene page
To show/hide the protein sequence of that gene (mostly corresponding to .1), click on the line with ‘> Smp_XXX.pep.fa’.
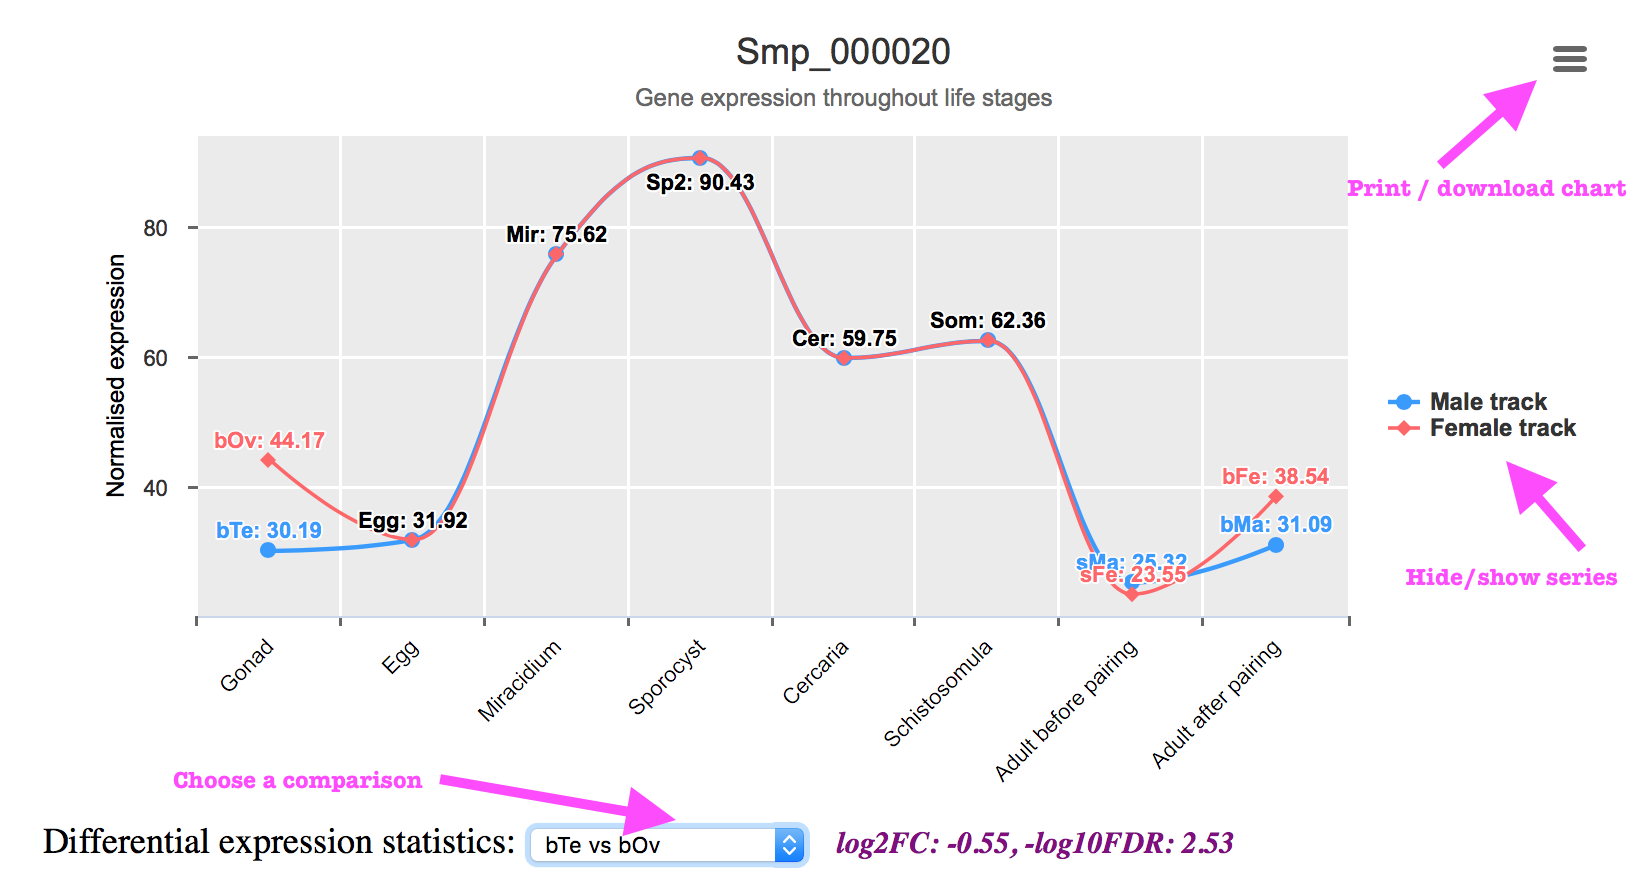
The expression chart:
- The expression values were indicated above the data point, but if they were overlapped with each other, you can click on the legend “Male track” or “Female track” to hide the line, click again will bring you the line back.
- You can print or export the expression chart as an image file. To do this, click on the menu icon on the top right corner of the chart, select “Print chart” or “Download”.
- To show the fold change and significance values, click on the dropdown menu below the chart and select a comparison. Please note that the comparisons were constructed mainly for consecutive life stages.
Differential Expression (the volcano chart) page or any other scatter plot
The volcano chart was plotted using log2FC (x-axis) and -log10FDR (y-axis) values derived from each comparison. There are red dot lines indicating the significant (FDR; default 0.01) and differential (fold-chage; default 2-fold) expression thresholds (log2(2) = 1; -log10(0.01) = 2). In the subtitle of the chart you can see the total number of DEGs under these thresholds.
Each single point indicates values for a gene. Move you mouse over the point will show you the gene name, and corresponding log2FC and -log10FDR values. Click on the point will direct you to that individual gene page with more information (domains, pathways, gene expression throughout different life stages, etc.).
You can zoom in the crowd area by dragging a frame with your mouse, or use two-finger-pinch if you are viewing it on your mobile phone or tablet. Click on “Reset zoom” will reset the chart view.
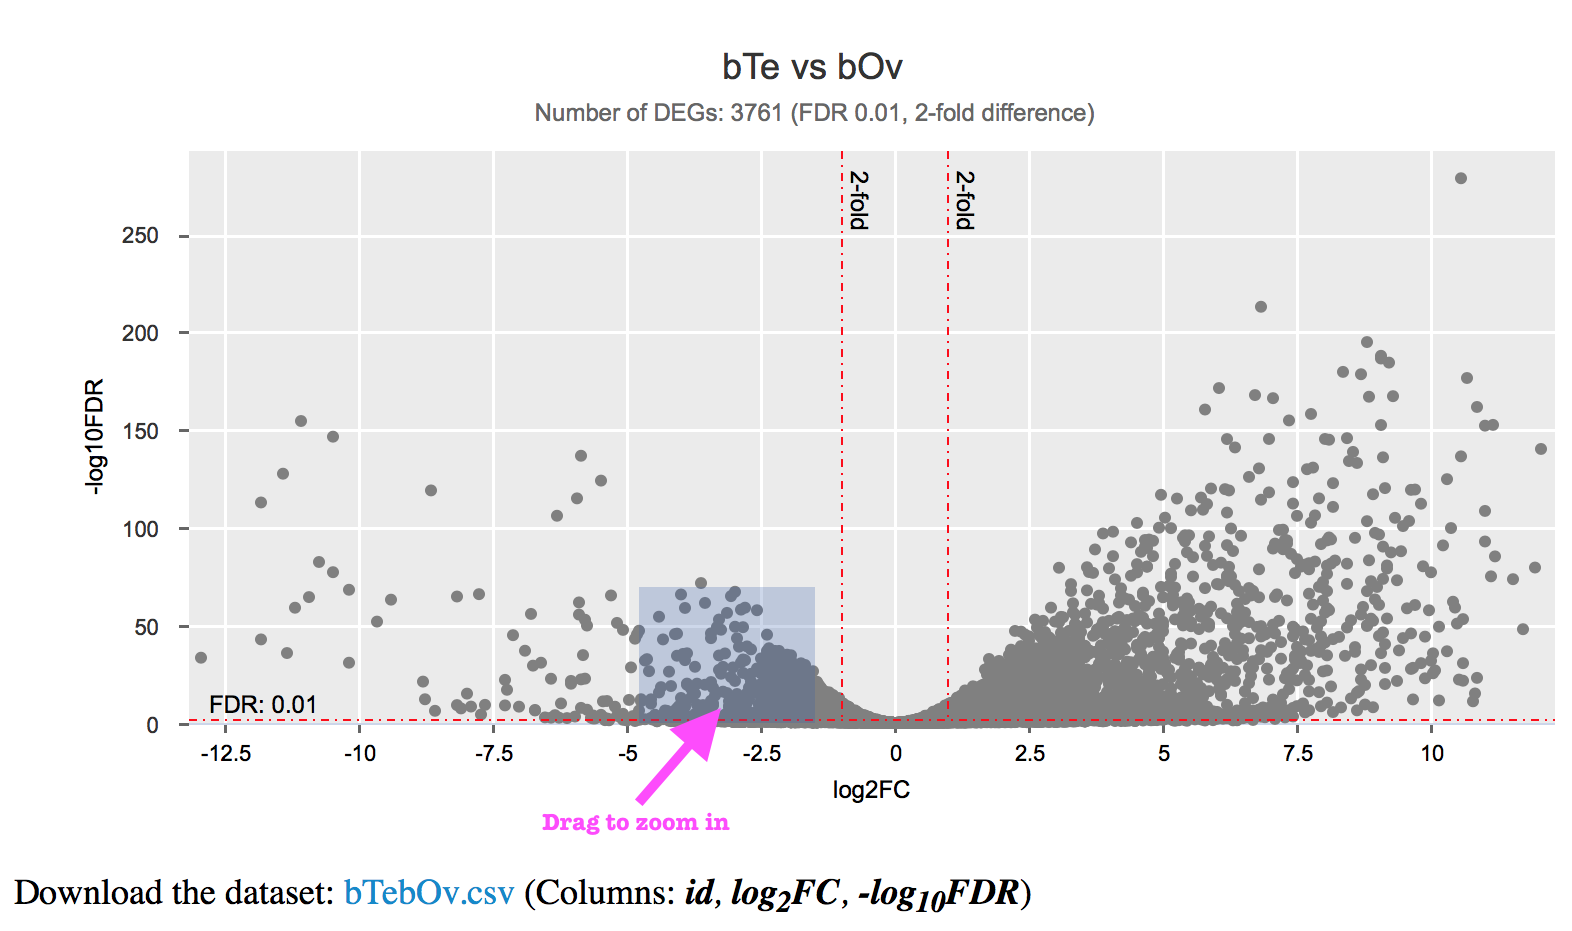
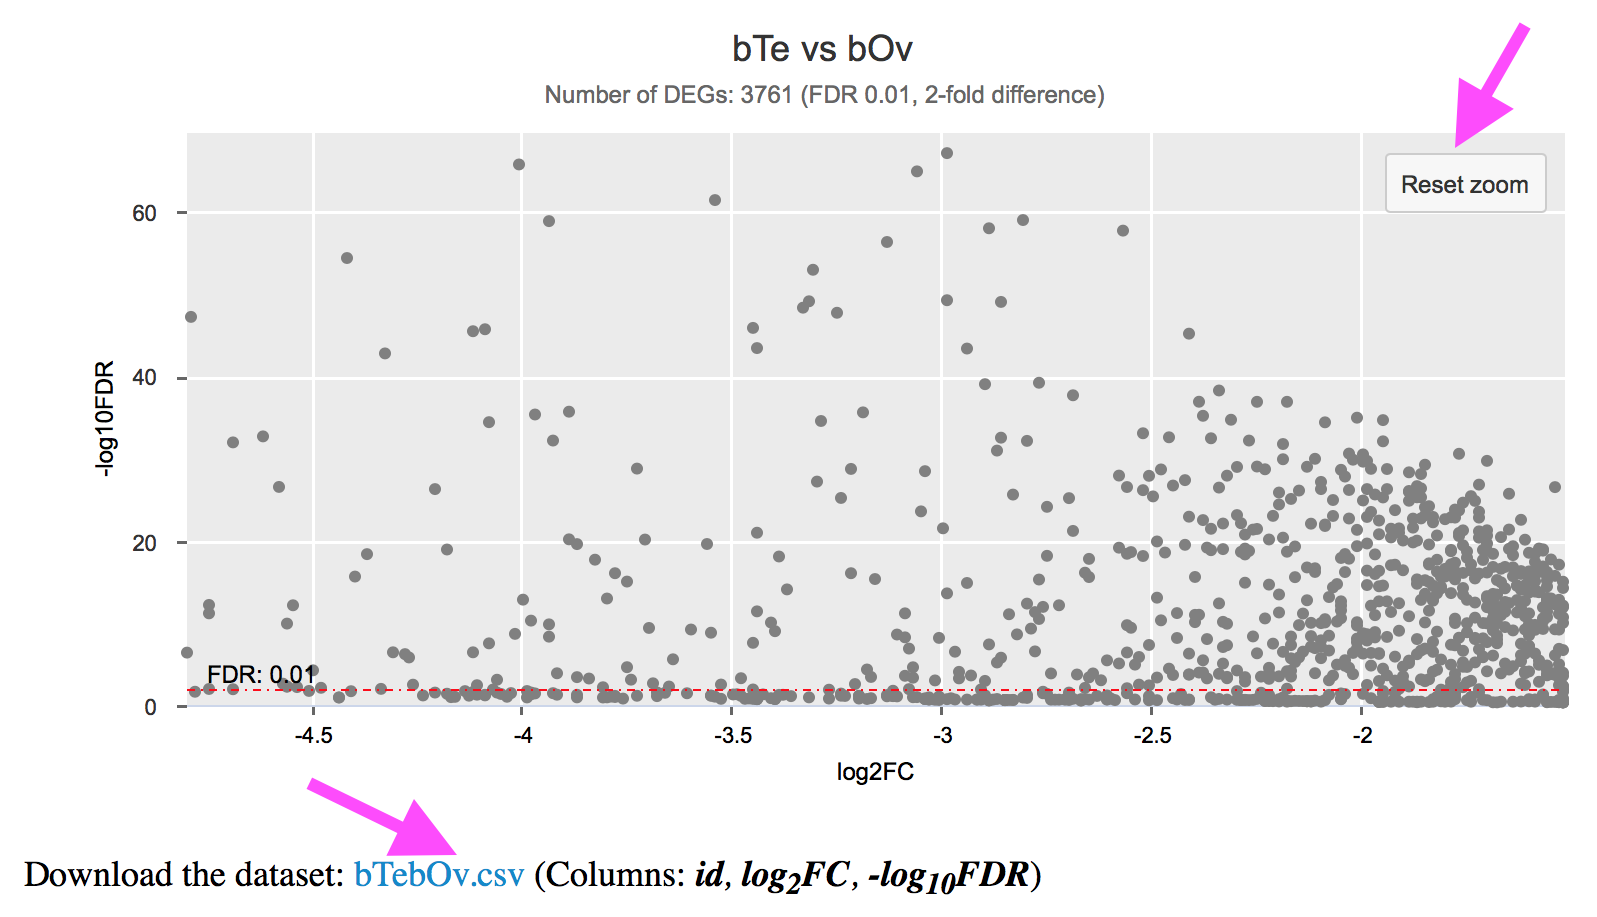
You can download the dataset used for the chart as well.
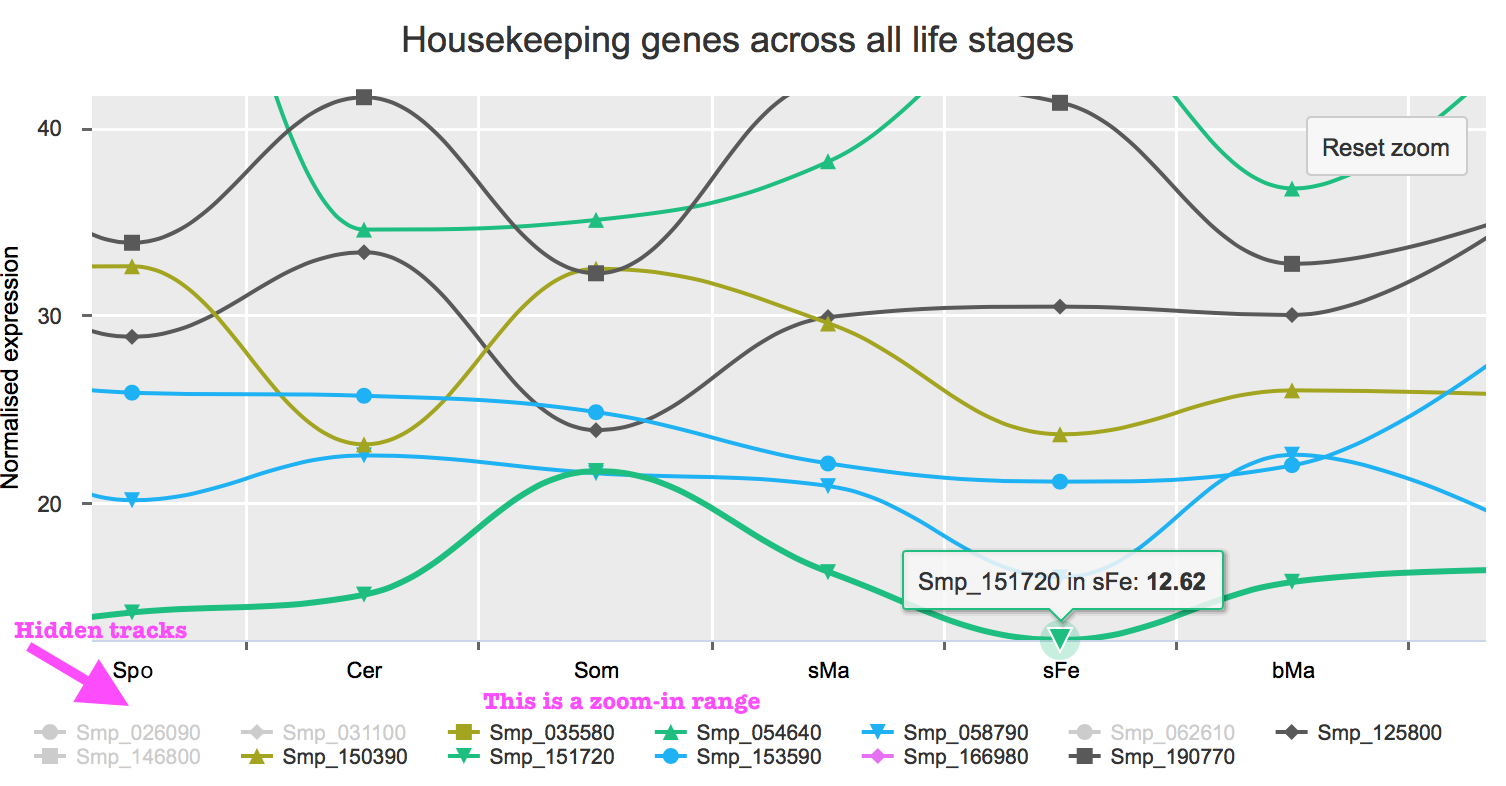
Housekeeping / top abundant / enriched gene charts
These are line charts. You can click on the gene name in the legend below the chart to hide its data points. This will redraw the y-axis based on a new scale, if necessarily. Click again to bring the data back.
You can also zoom in to see details in a certain range.
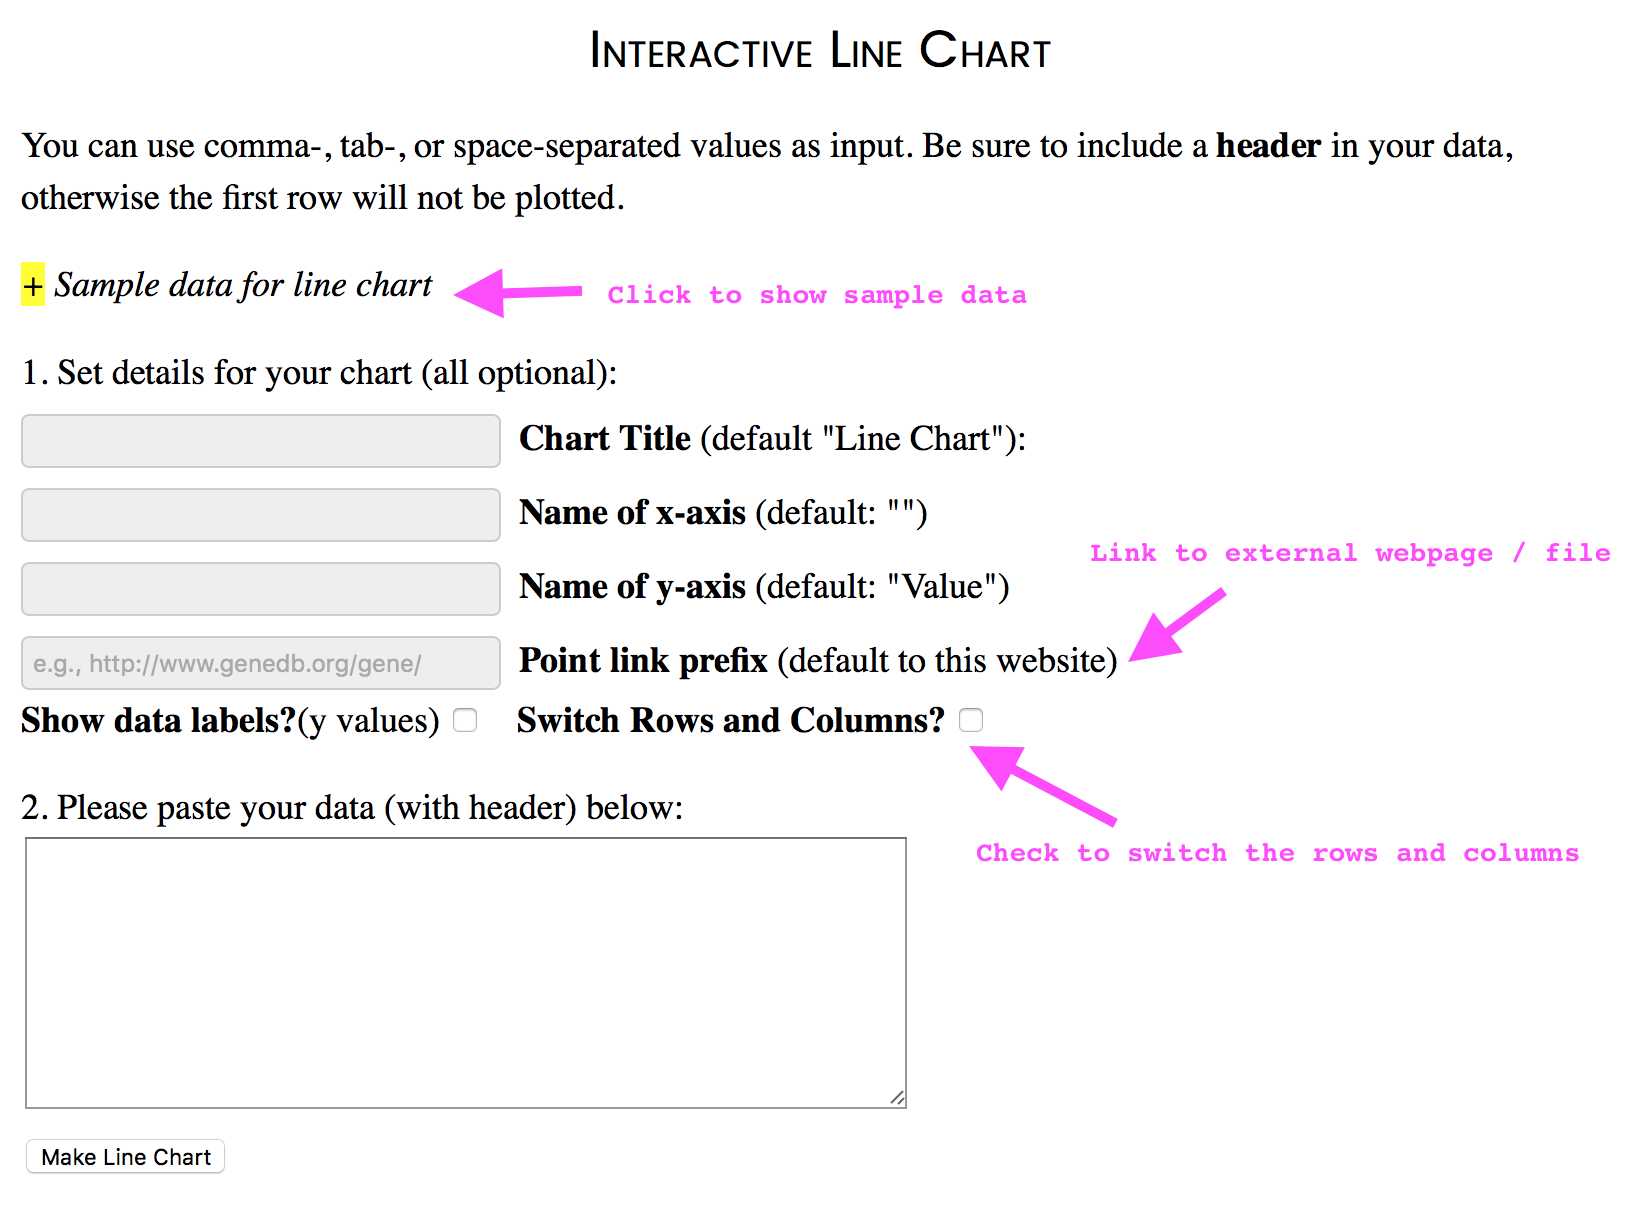
Visualise your own data in an interactive way
You can make interactive chart with your own data (in XY plot or line chart). Go to “Visualise your data”, input your data, set attributes, and chart! You can switch rows and columns when making line charts (useful function for RNAseq read counts and expression table).
Accknowledgements
This web portal has been created with the following tools and libraries:
Hugo, NewsPrint theme, jQuery, Highcharts, WordArt, TipueSearch, and IVIS.